How To Store Web Reports (Addendum 2)
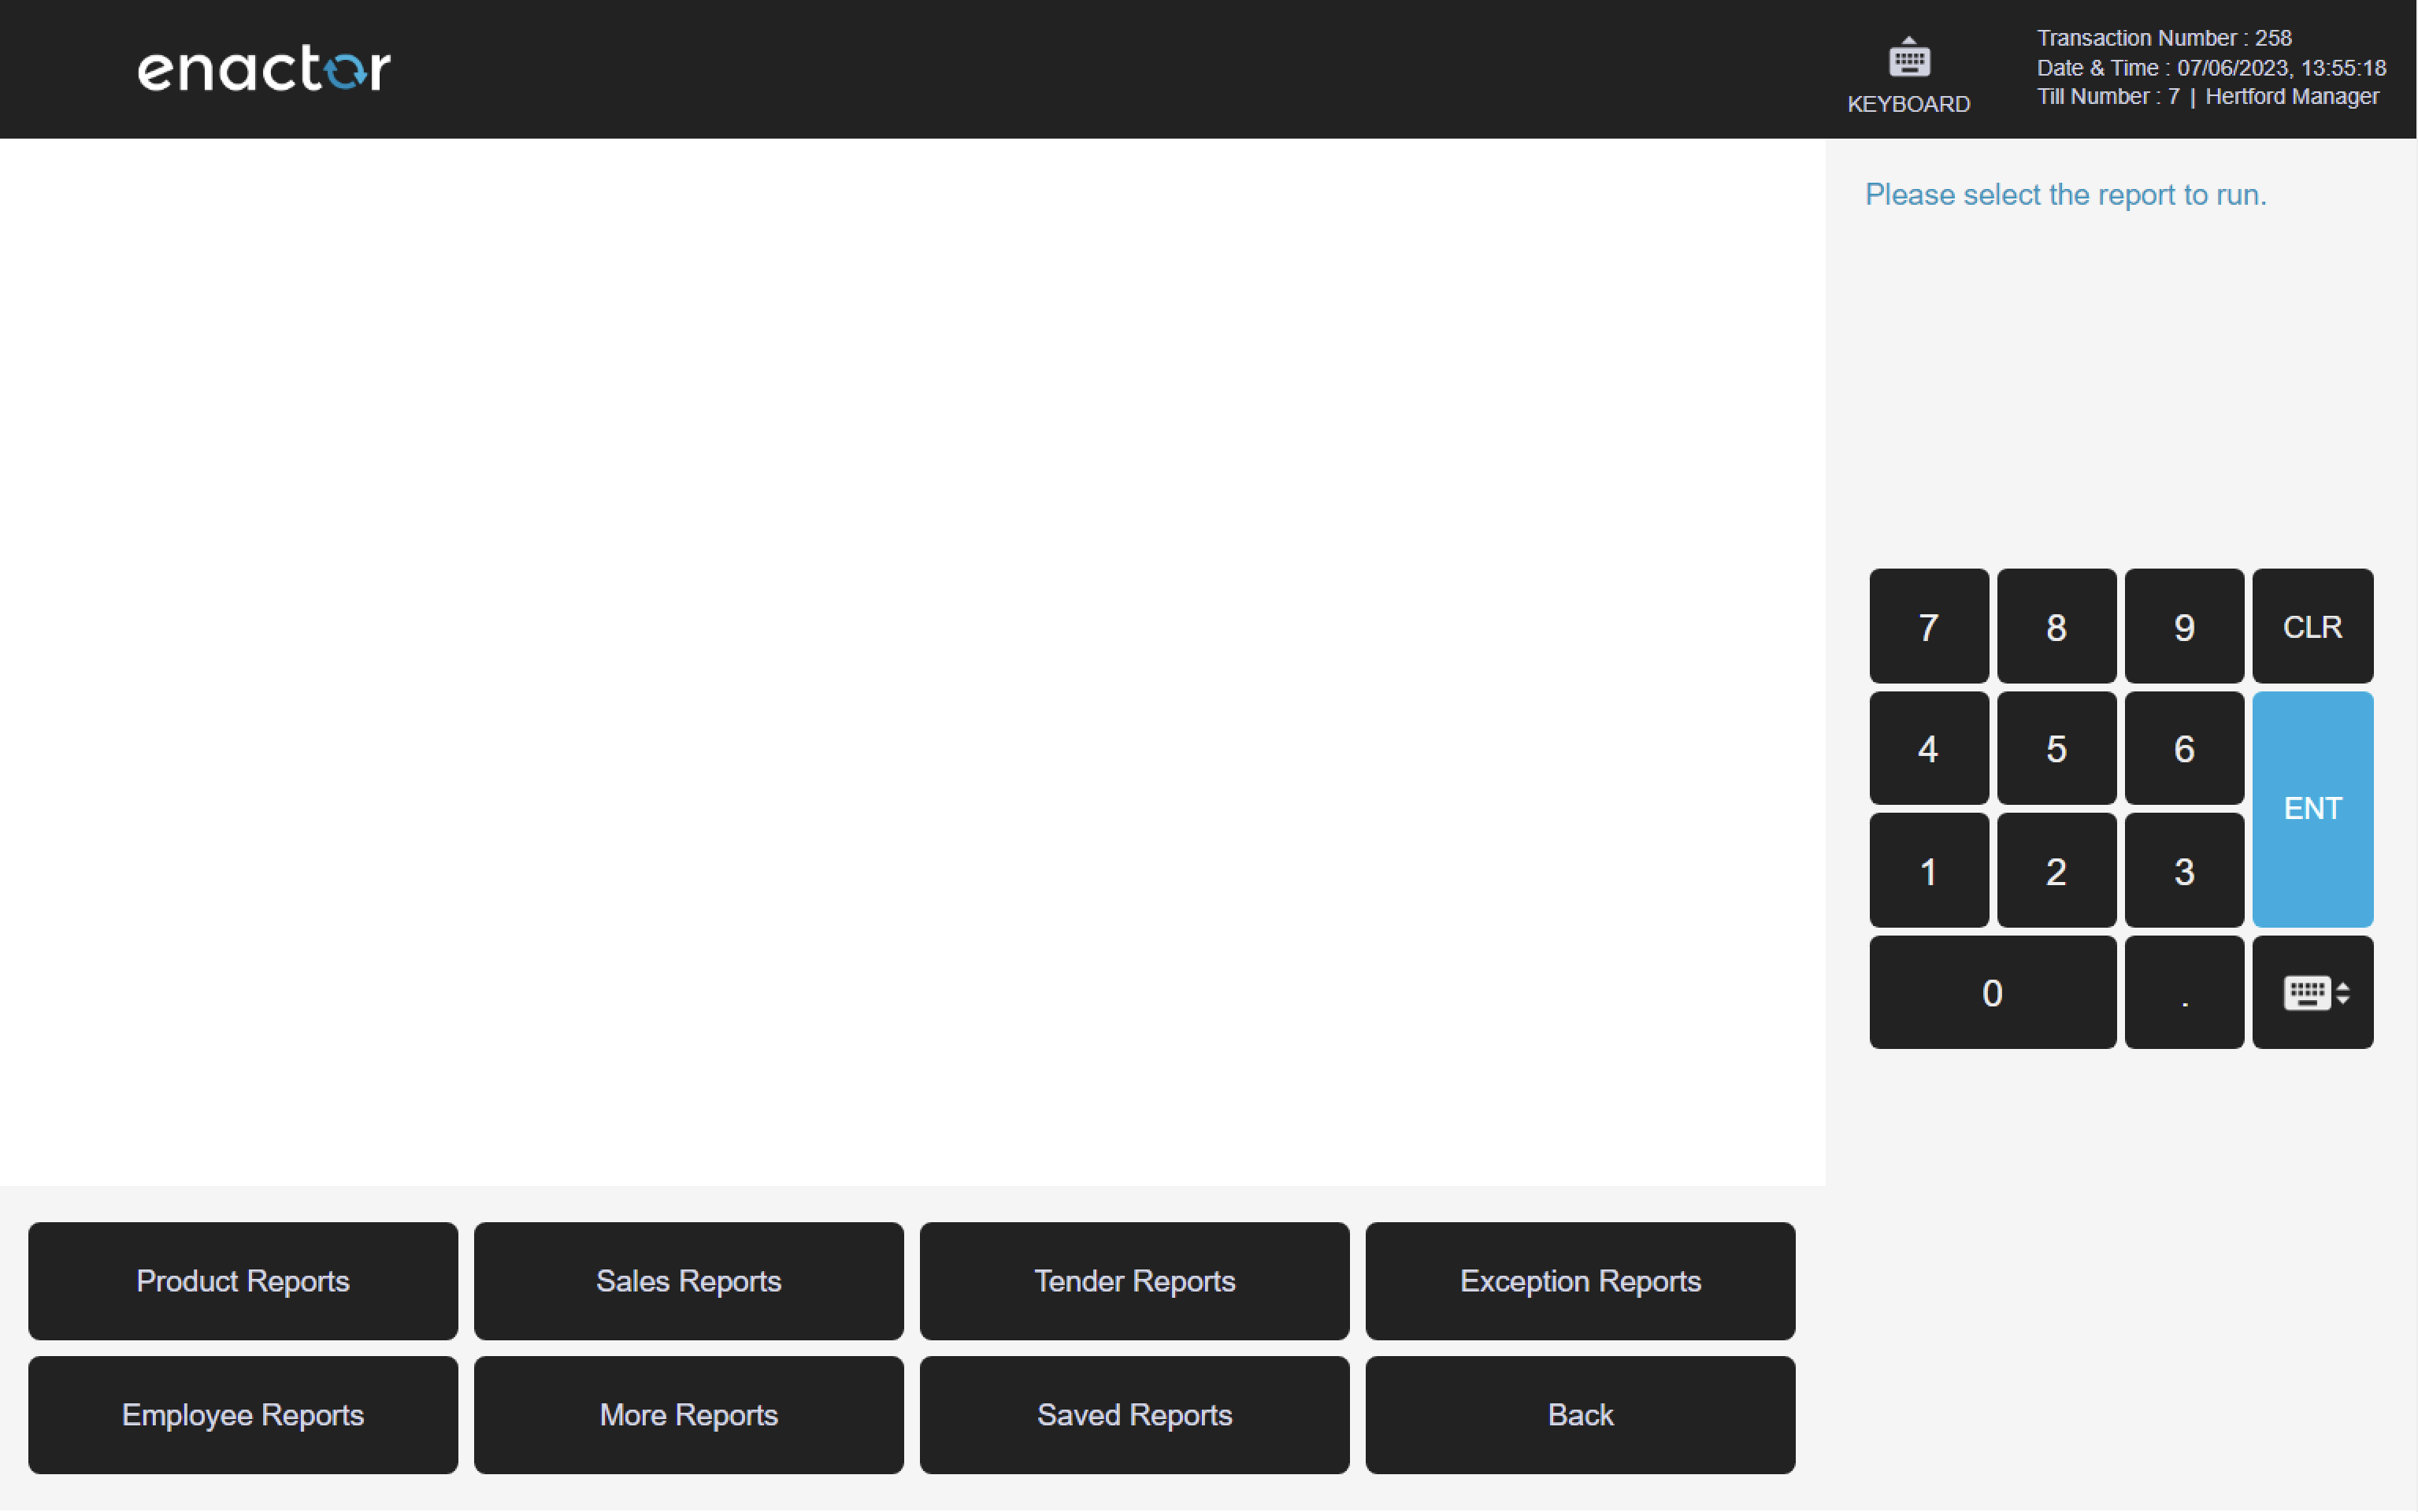
Store Web Reports can be accessed from the Enactor POS via: Sale > Management > Reports > Web Reports
The Store Web Reports module provides a comprehensive set of reporting tools covering eight categories: Product Reports, Sales Reports, Tender Reports, Exception Reports, Employee Reports, Cash Management Reports, ICC Reader Reports, and Saved Reports. Each category contains a number of individual reports, each with configurable filter criteria and structured output columns.
1 Product Reports
Path: Web Reports > Product Reports
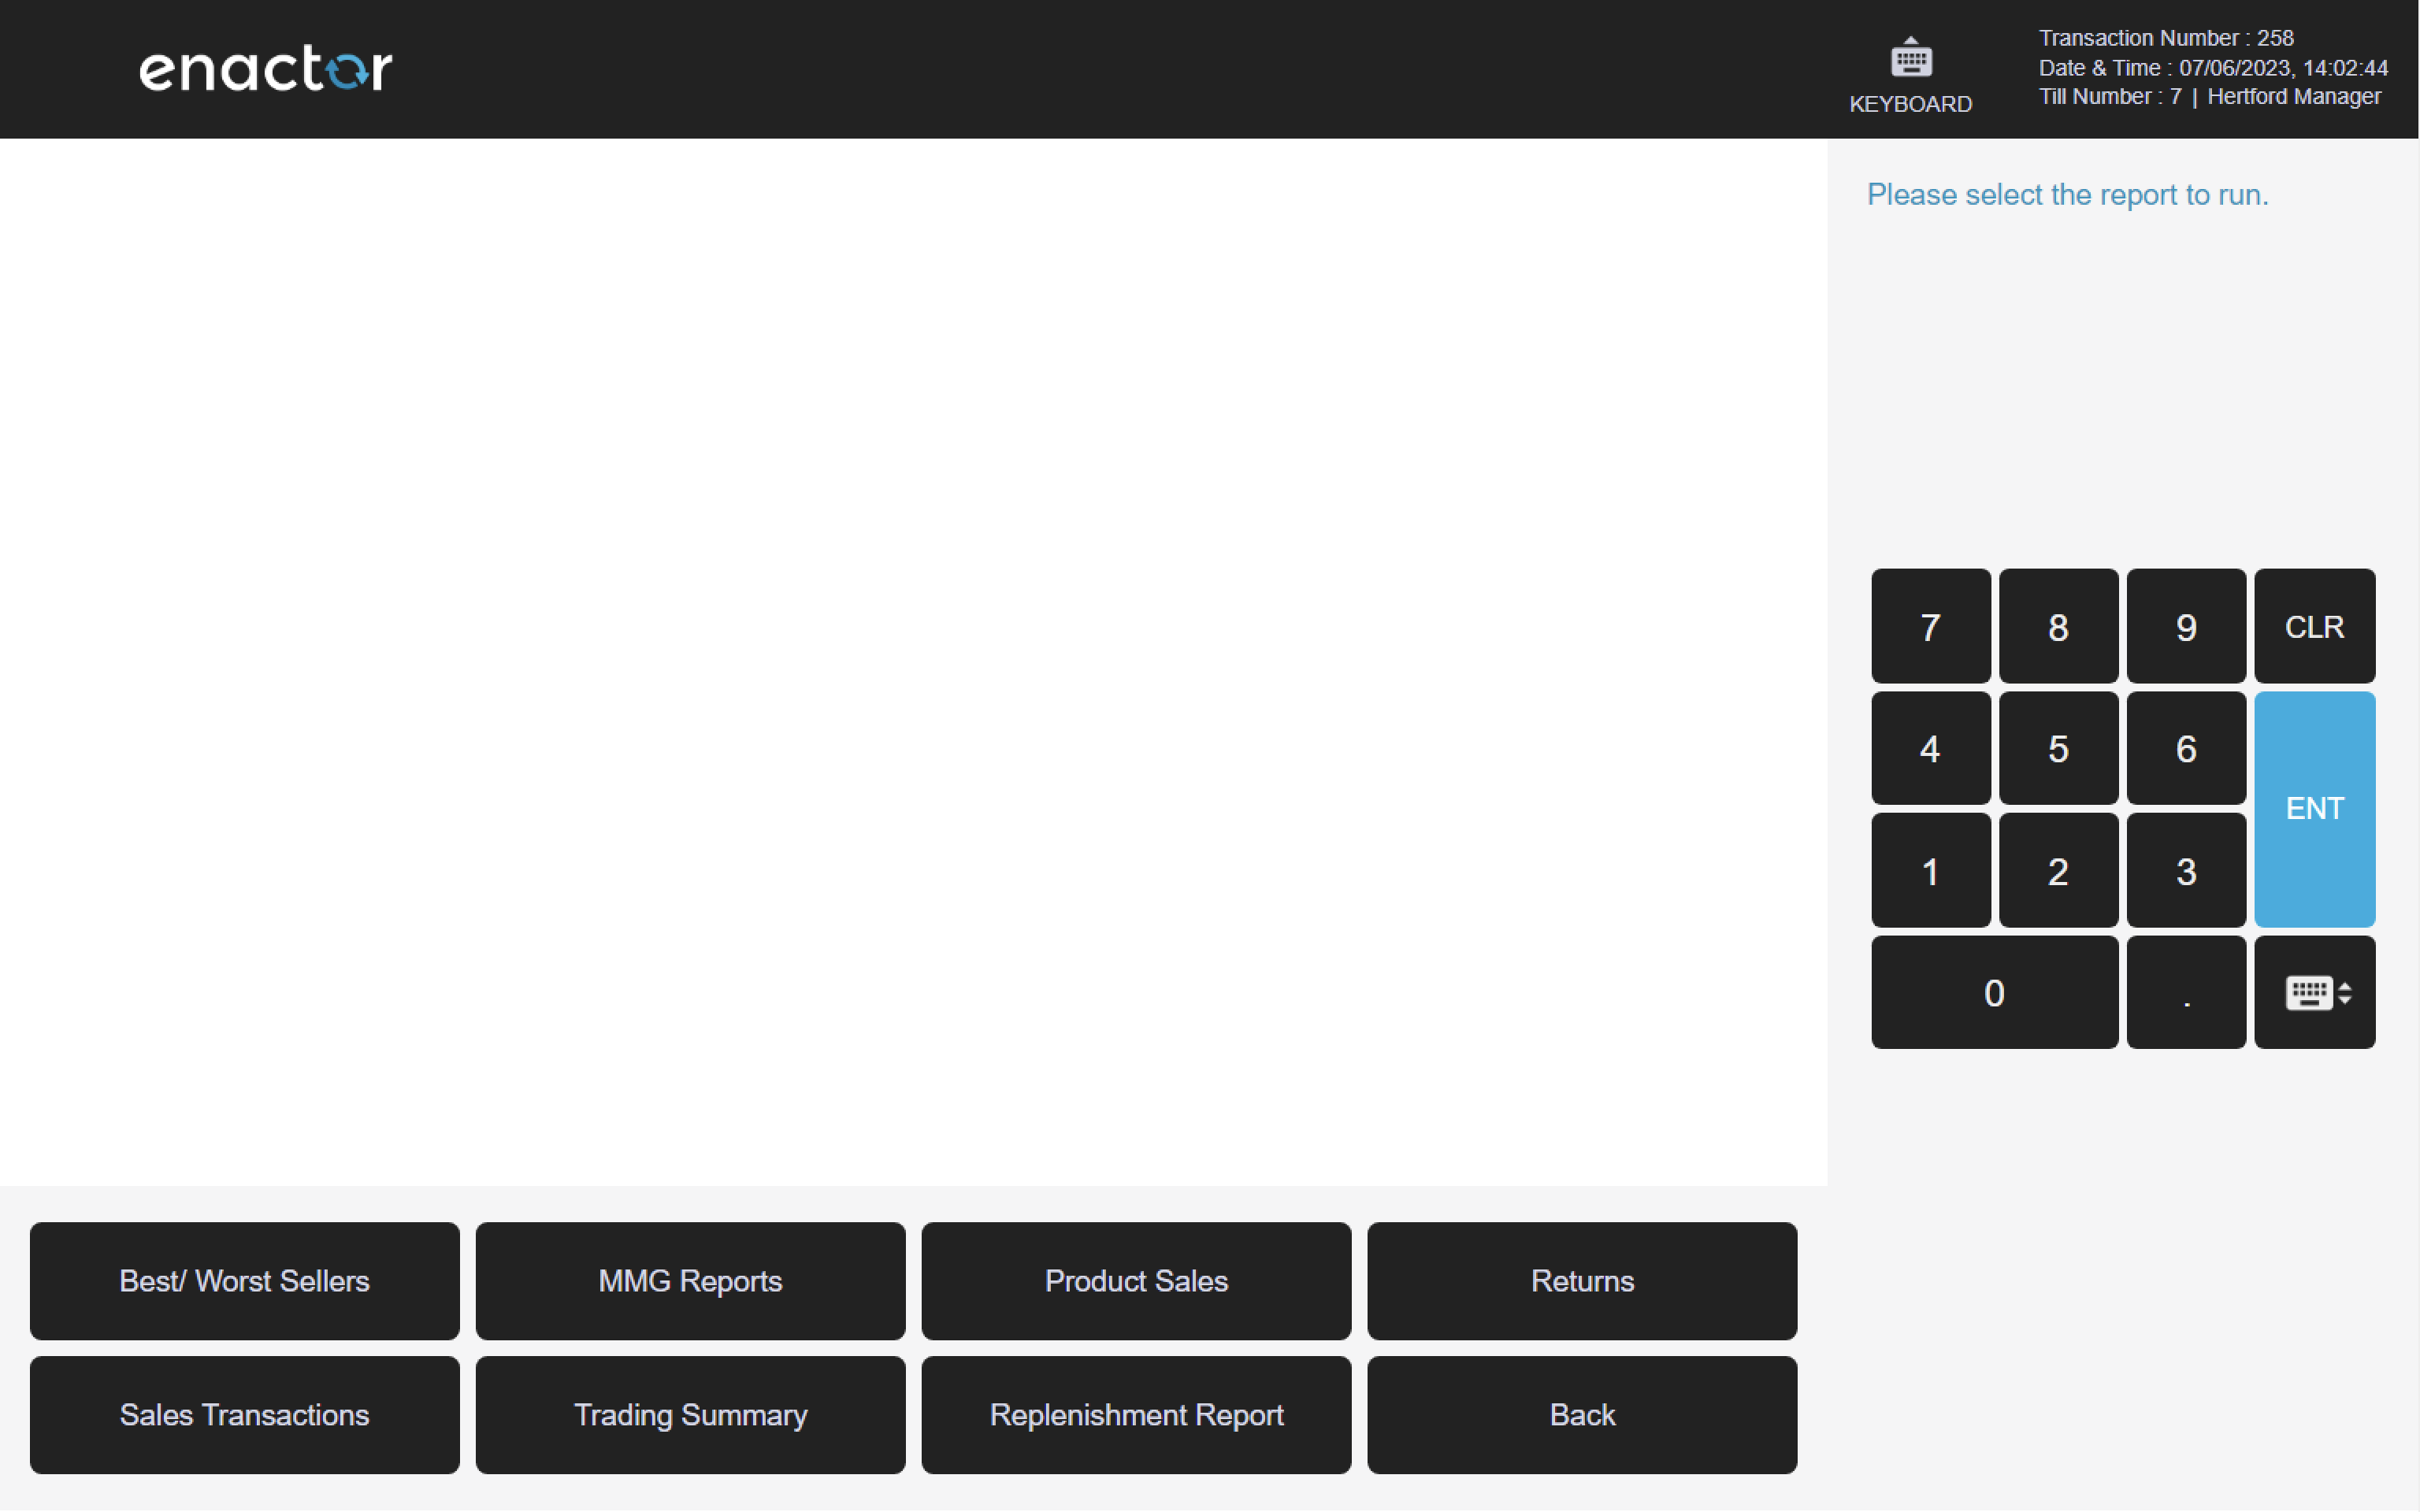
1.1 Best / Worst Sellers
Path: Product Reports > Best / Worst Sellers
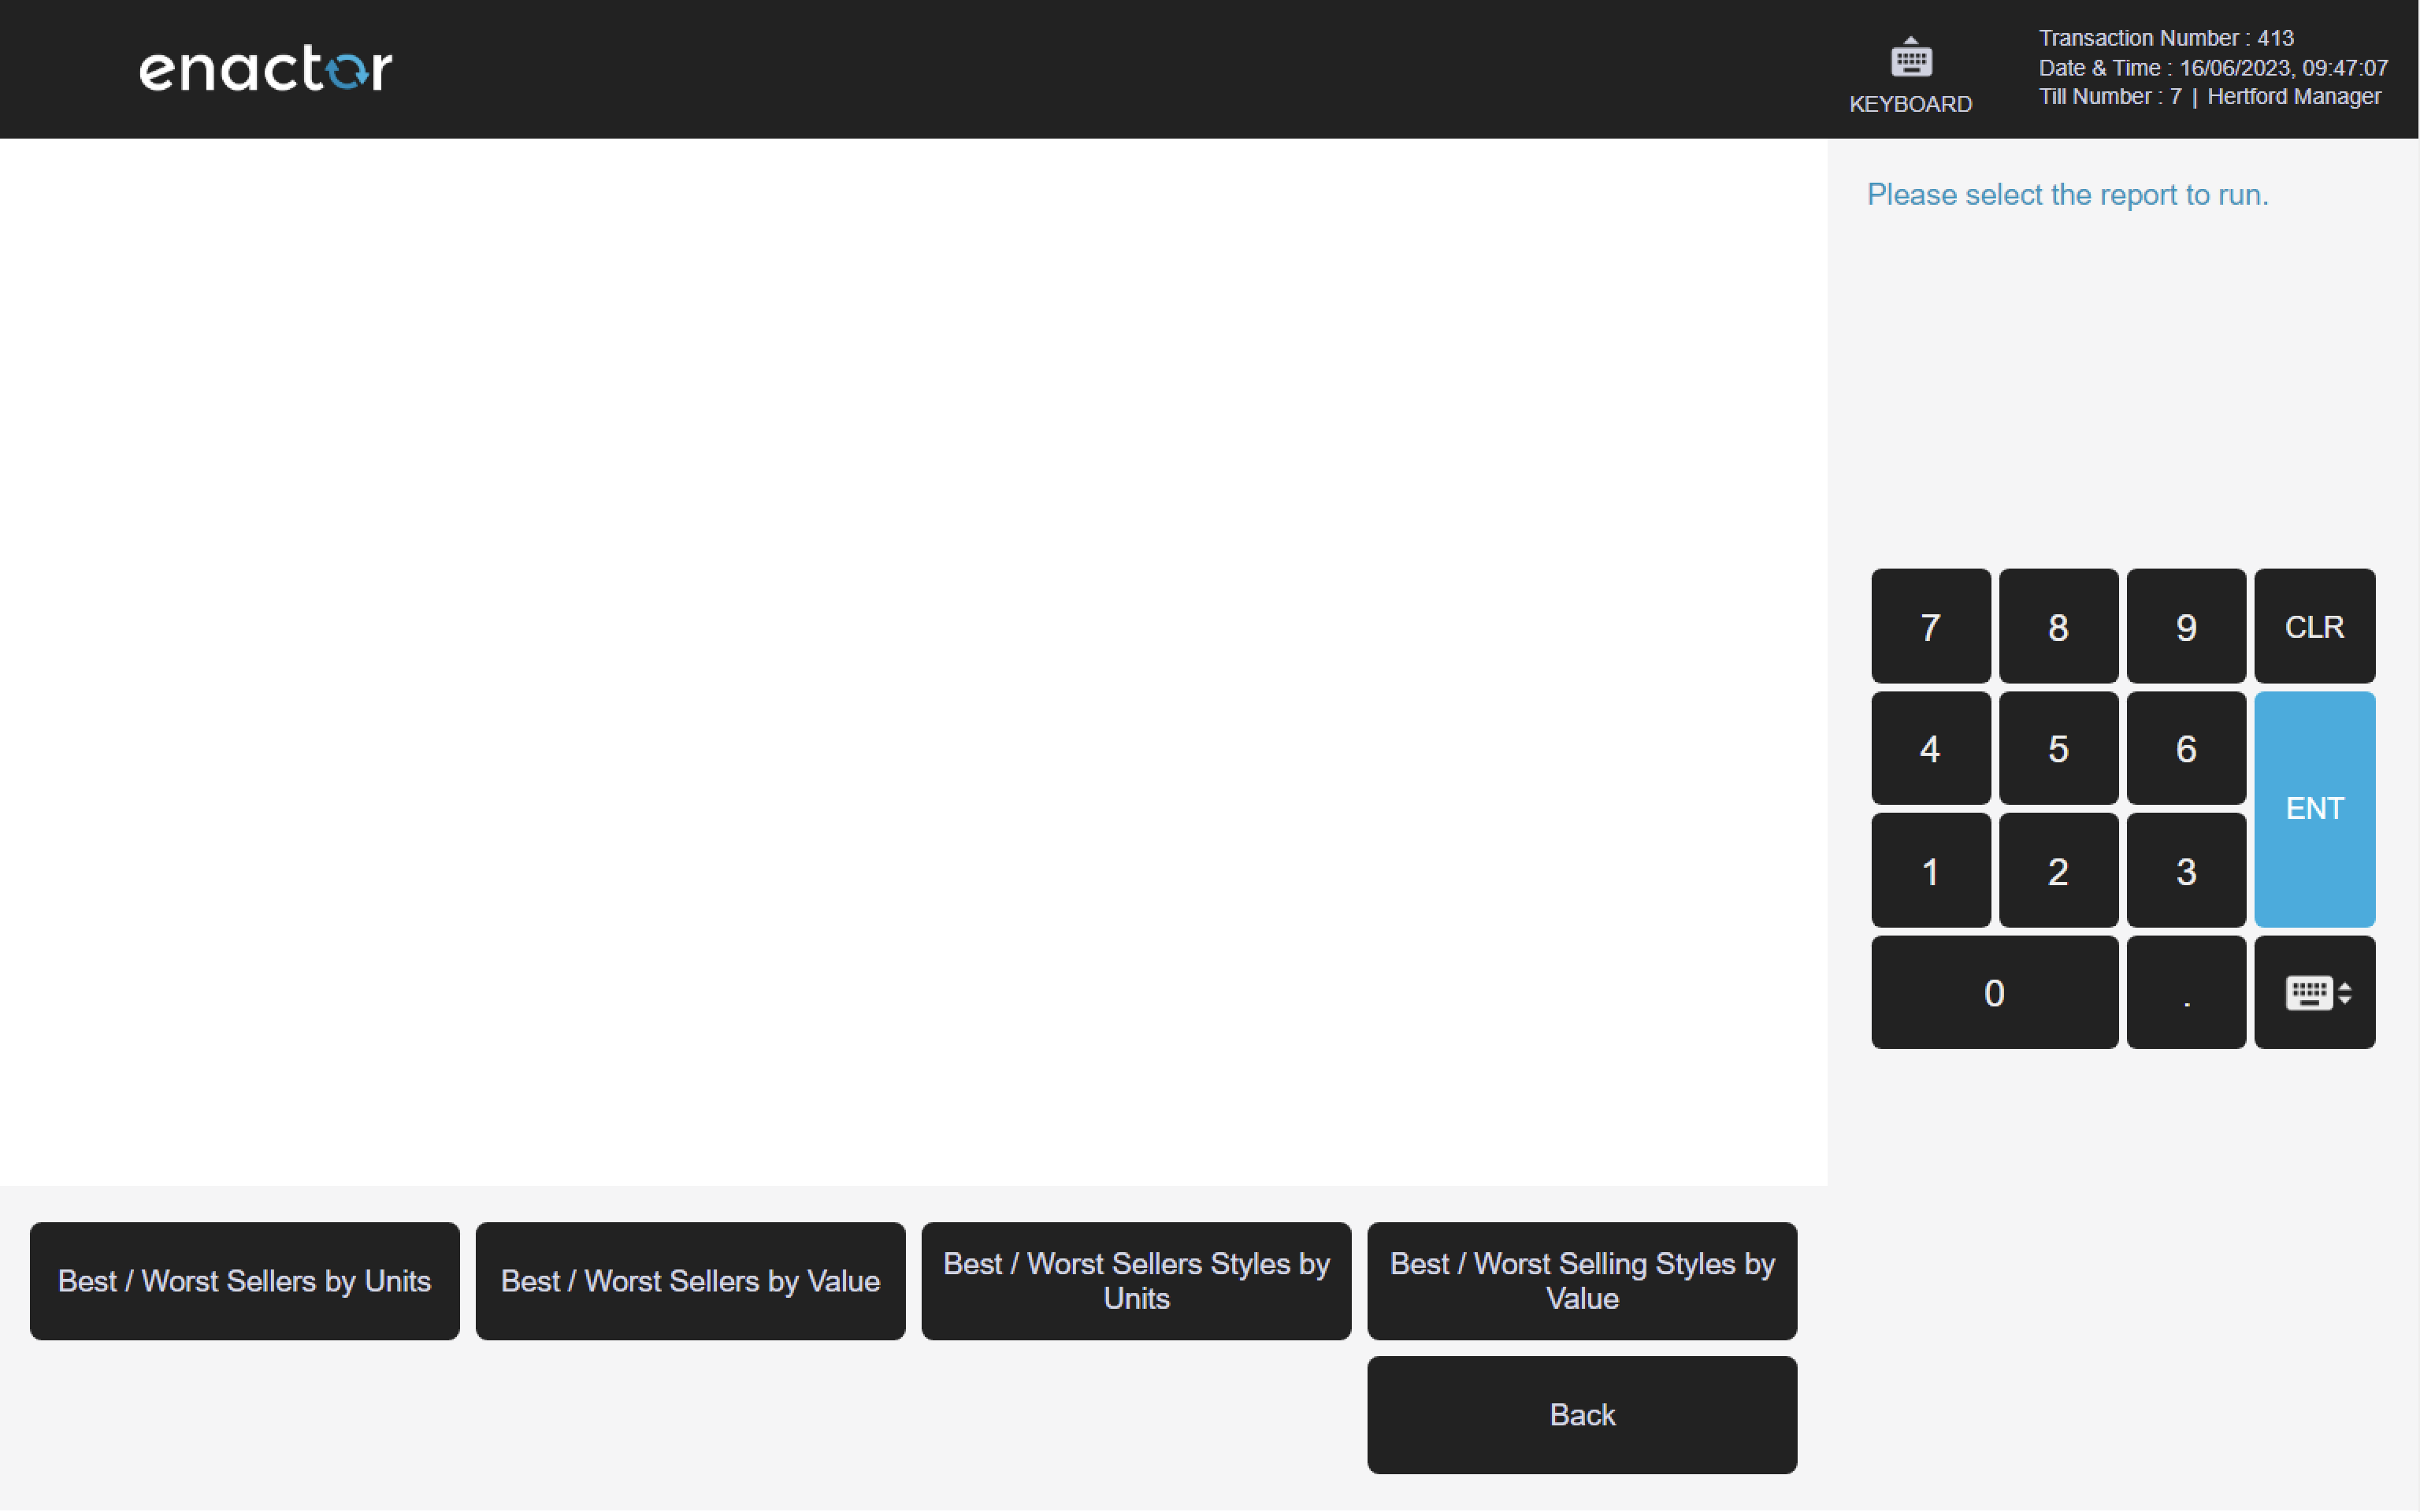
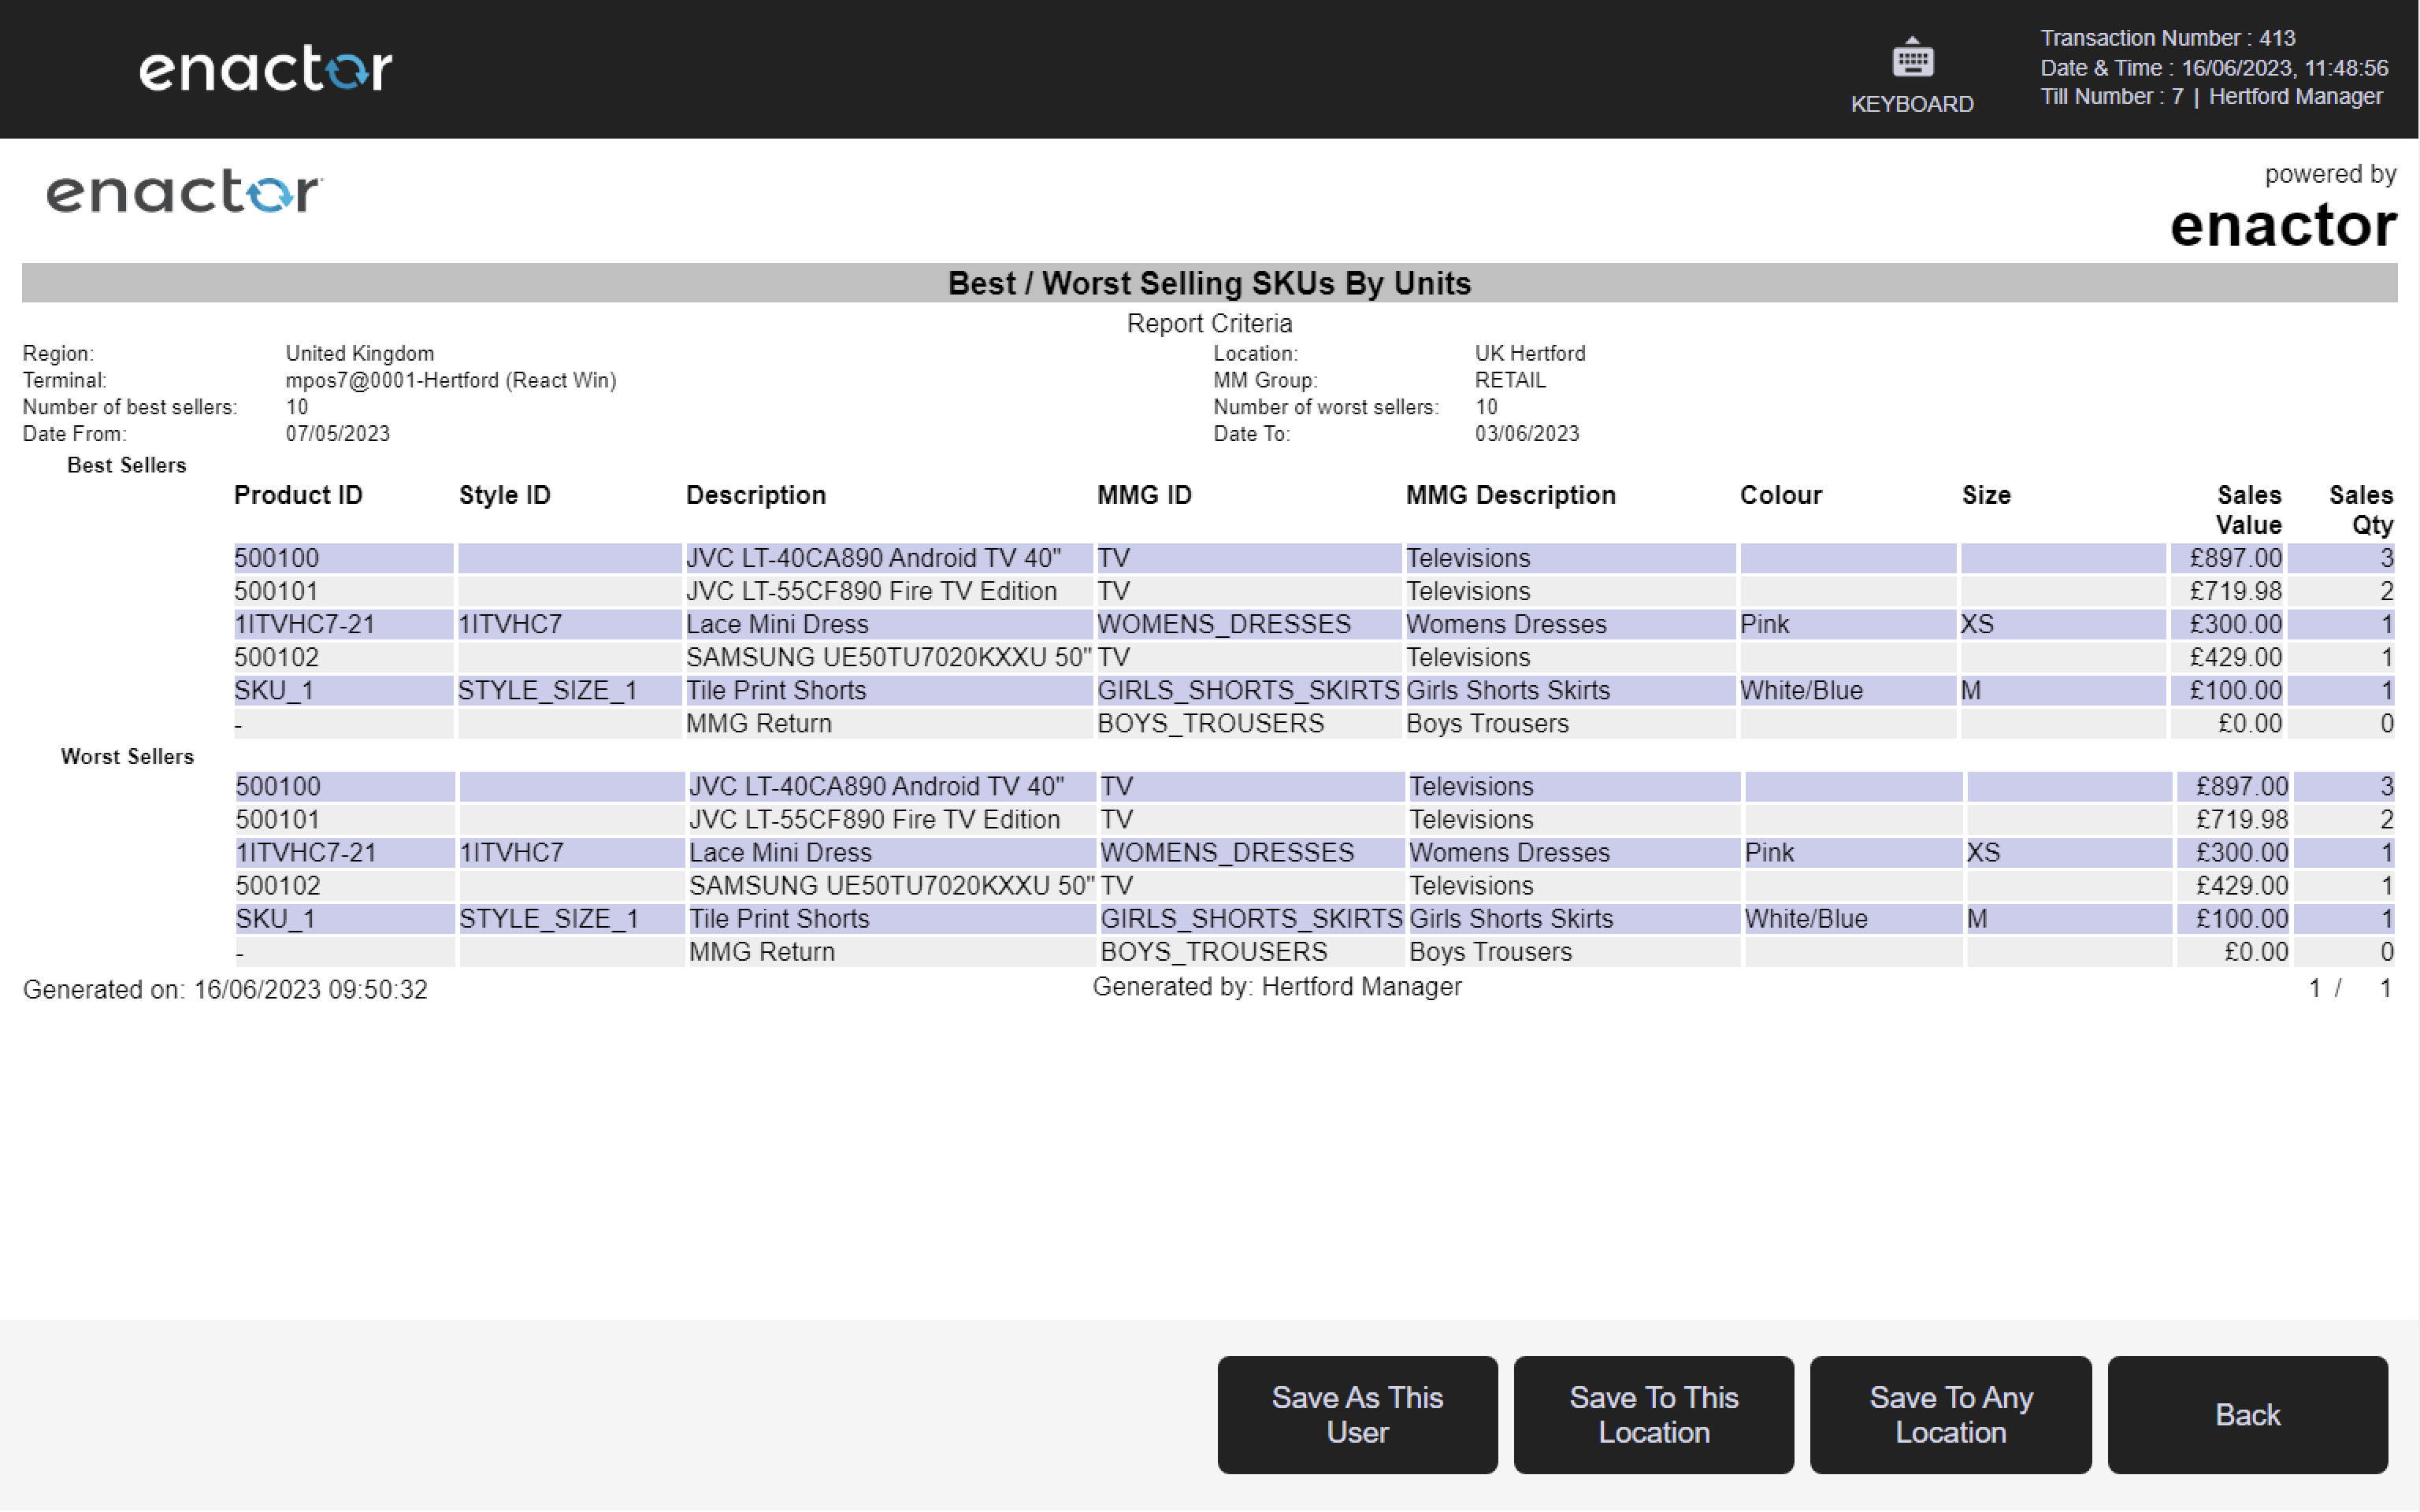
1.1.1 Best / Worst Sellers by Units
Path: Best / Worst Sellers > Best / Worst Sellers by Units
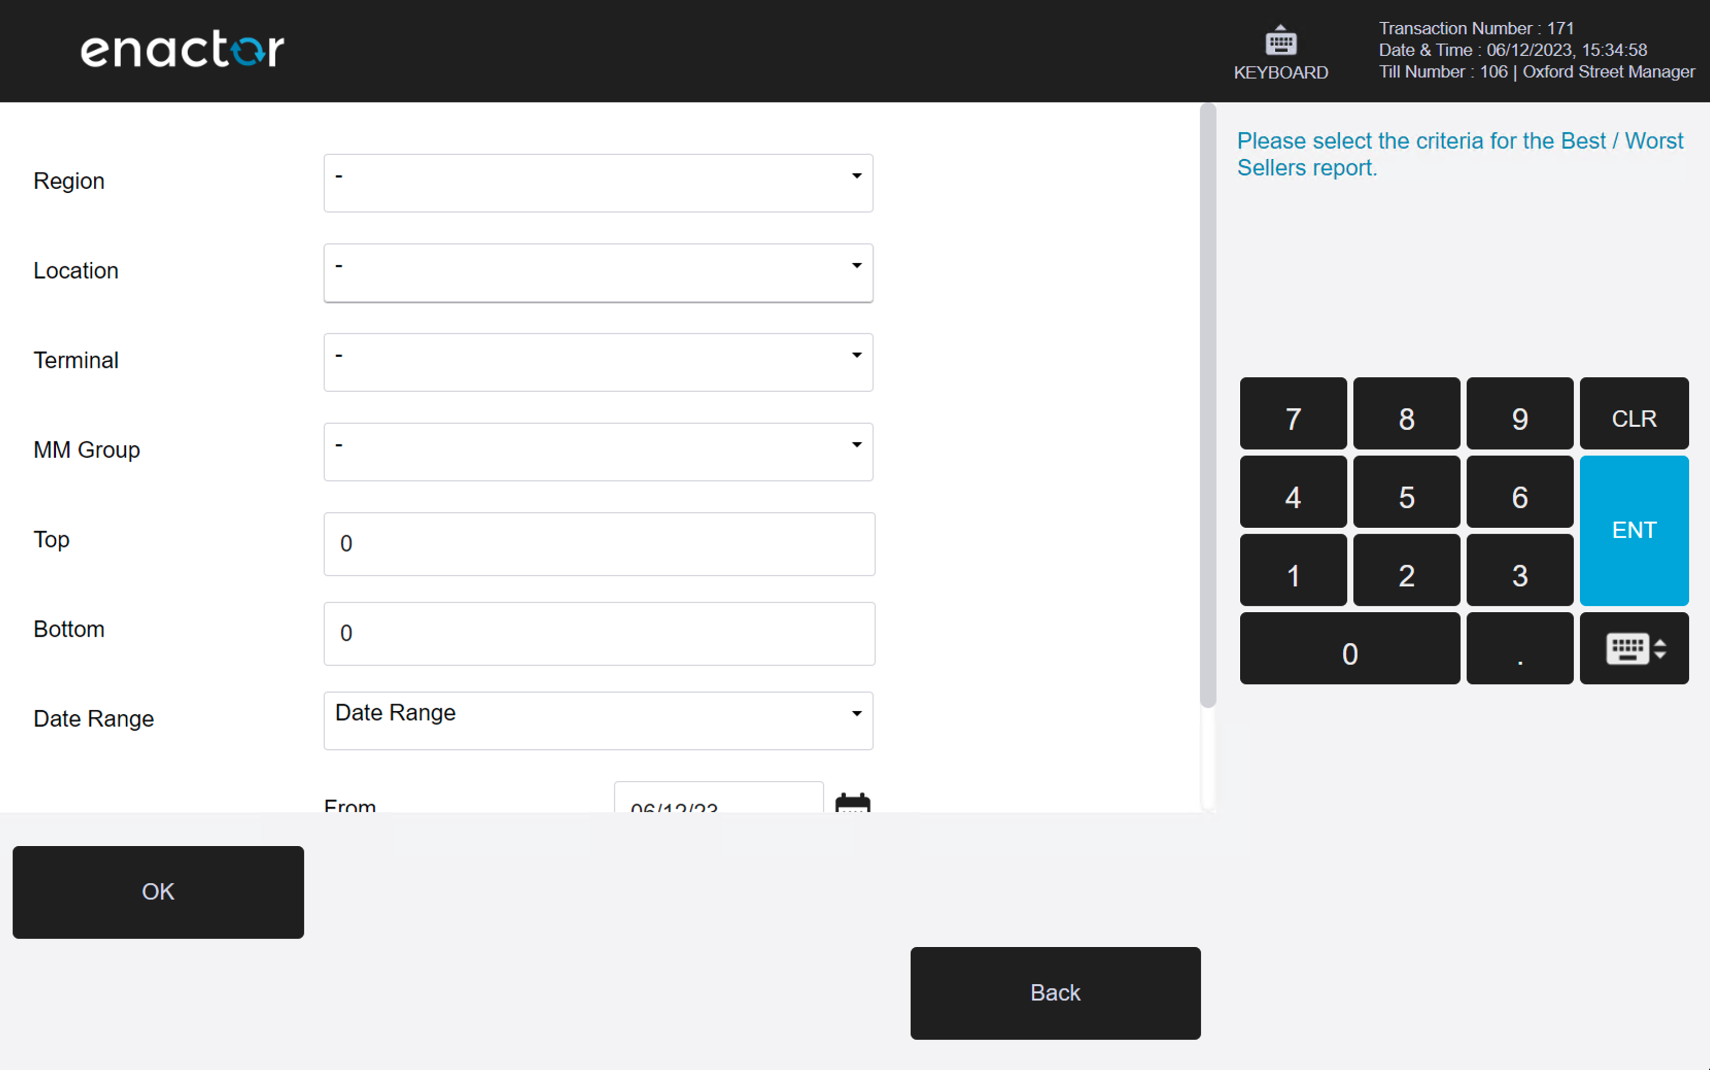
View best/worst selling product information by units.
Filter Criteria
| Property | Description |
|---|---|
| Region | Dropdown selection of available regions. |
| Location | Dropdown selection of locations, filtered by the selected region. |
| Terminal | Dropdown selection of terminals, filtered by the selected location. |
| MM Group | Dropdown selection of merchandise management group. |
| Top | Numeric input for the number of top-selling products to display (default: 10). |
| Bottom | Numeric input for the number of worst-selling products to display (default: 10). |
| Date Range | Date range selector: Date Range / Month in Year / Week in Year / Season / Quarter, with year, month/week/season/quarter, and from/to date inputs. |
Output Columns
| Property | Description |
|---|---|
| Product ID | The unique identifier of the product. |
| Style ID | The style identifier associated with the product. |
| Description | The product description. |
| MMG ID | The merchandise management group identifier. |
| MMG Description | The description of the merchandise management group. |
| Colour | The colour variant of the product. |
| Size | The size variant of the product. |
| Sales Value | The total sales value for the product within the selected period. |
| Sales Qty | The total sales quantity for the product within the selected period. |

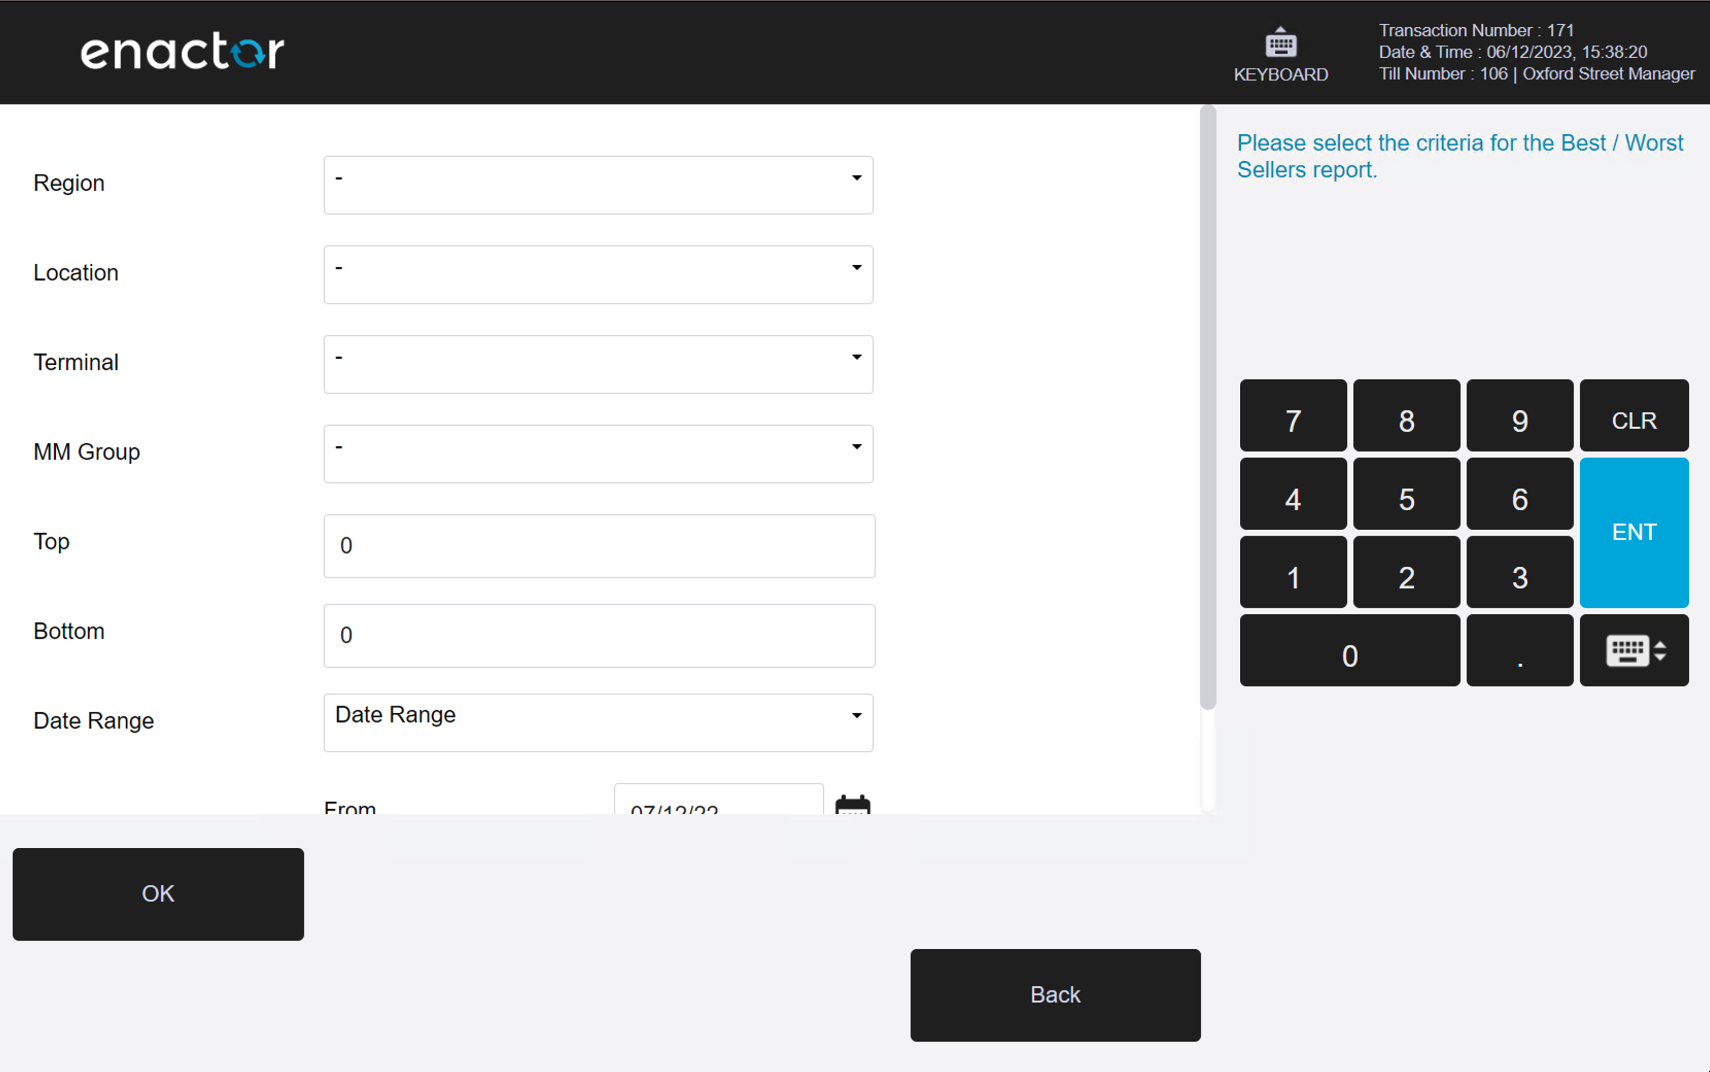
1.1.2 Best / Worst Sellers by Value
Path: Best / Worst Sellers > Best / Worst Sellers by Value
View best/worst selling product information by value.
Filter Criteria
| Property | Description |
|---|---|
| Region | Dropdown selection of available regions. |
| Location | Dropdown selection of locations, filtered by the selected region. |
| Terminal | Dropdown selection of terminals, filtered by the selected location. |
| MM Group | Dropdown selection of merchandise management group. |
| Top | Numeric input for the number of top-selling products to display (default: 10). |
| Bottom | Numeric input for the number of worst-selling products to display (default: 10). |
| Date Range | Date range selector: Date Range / Month in Year / Week in Year / Season / Quarter, with year, month/week/season/quarter, and from/to date inputs. |
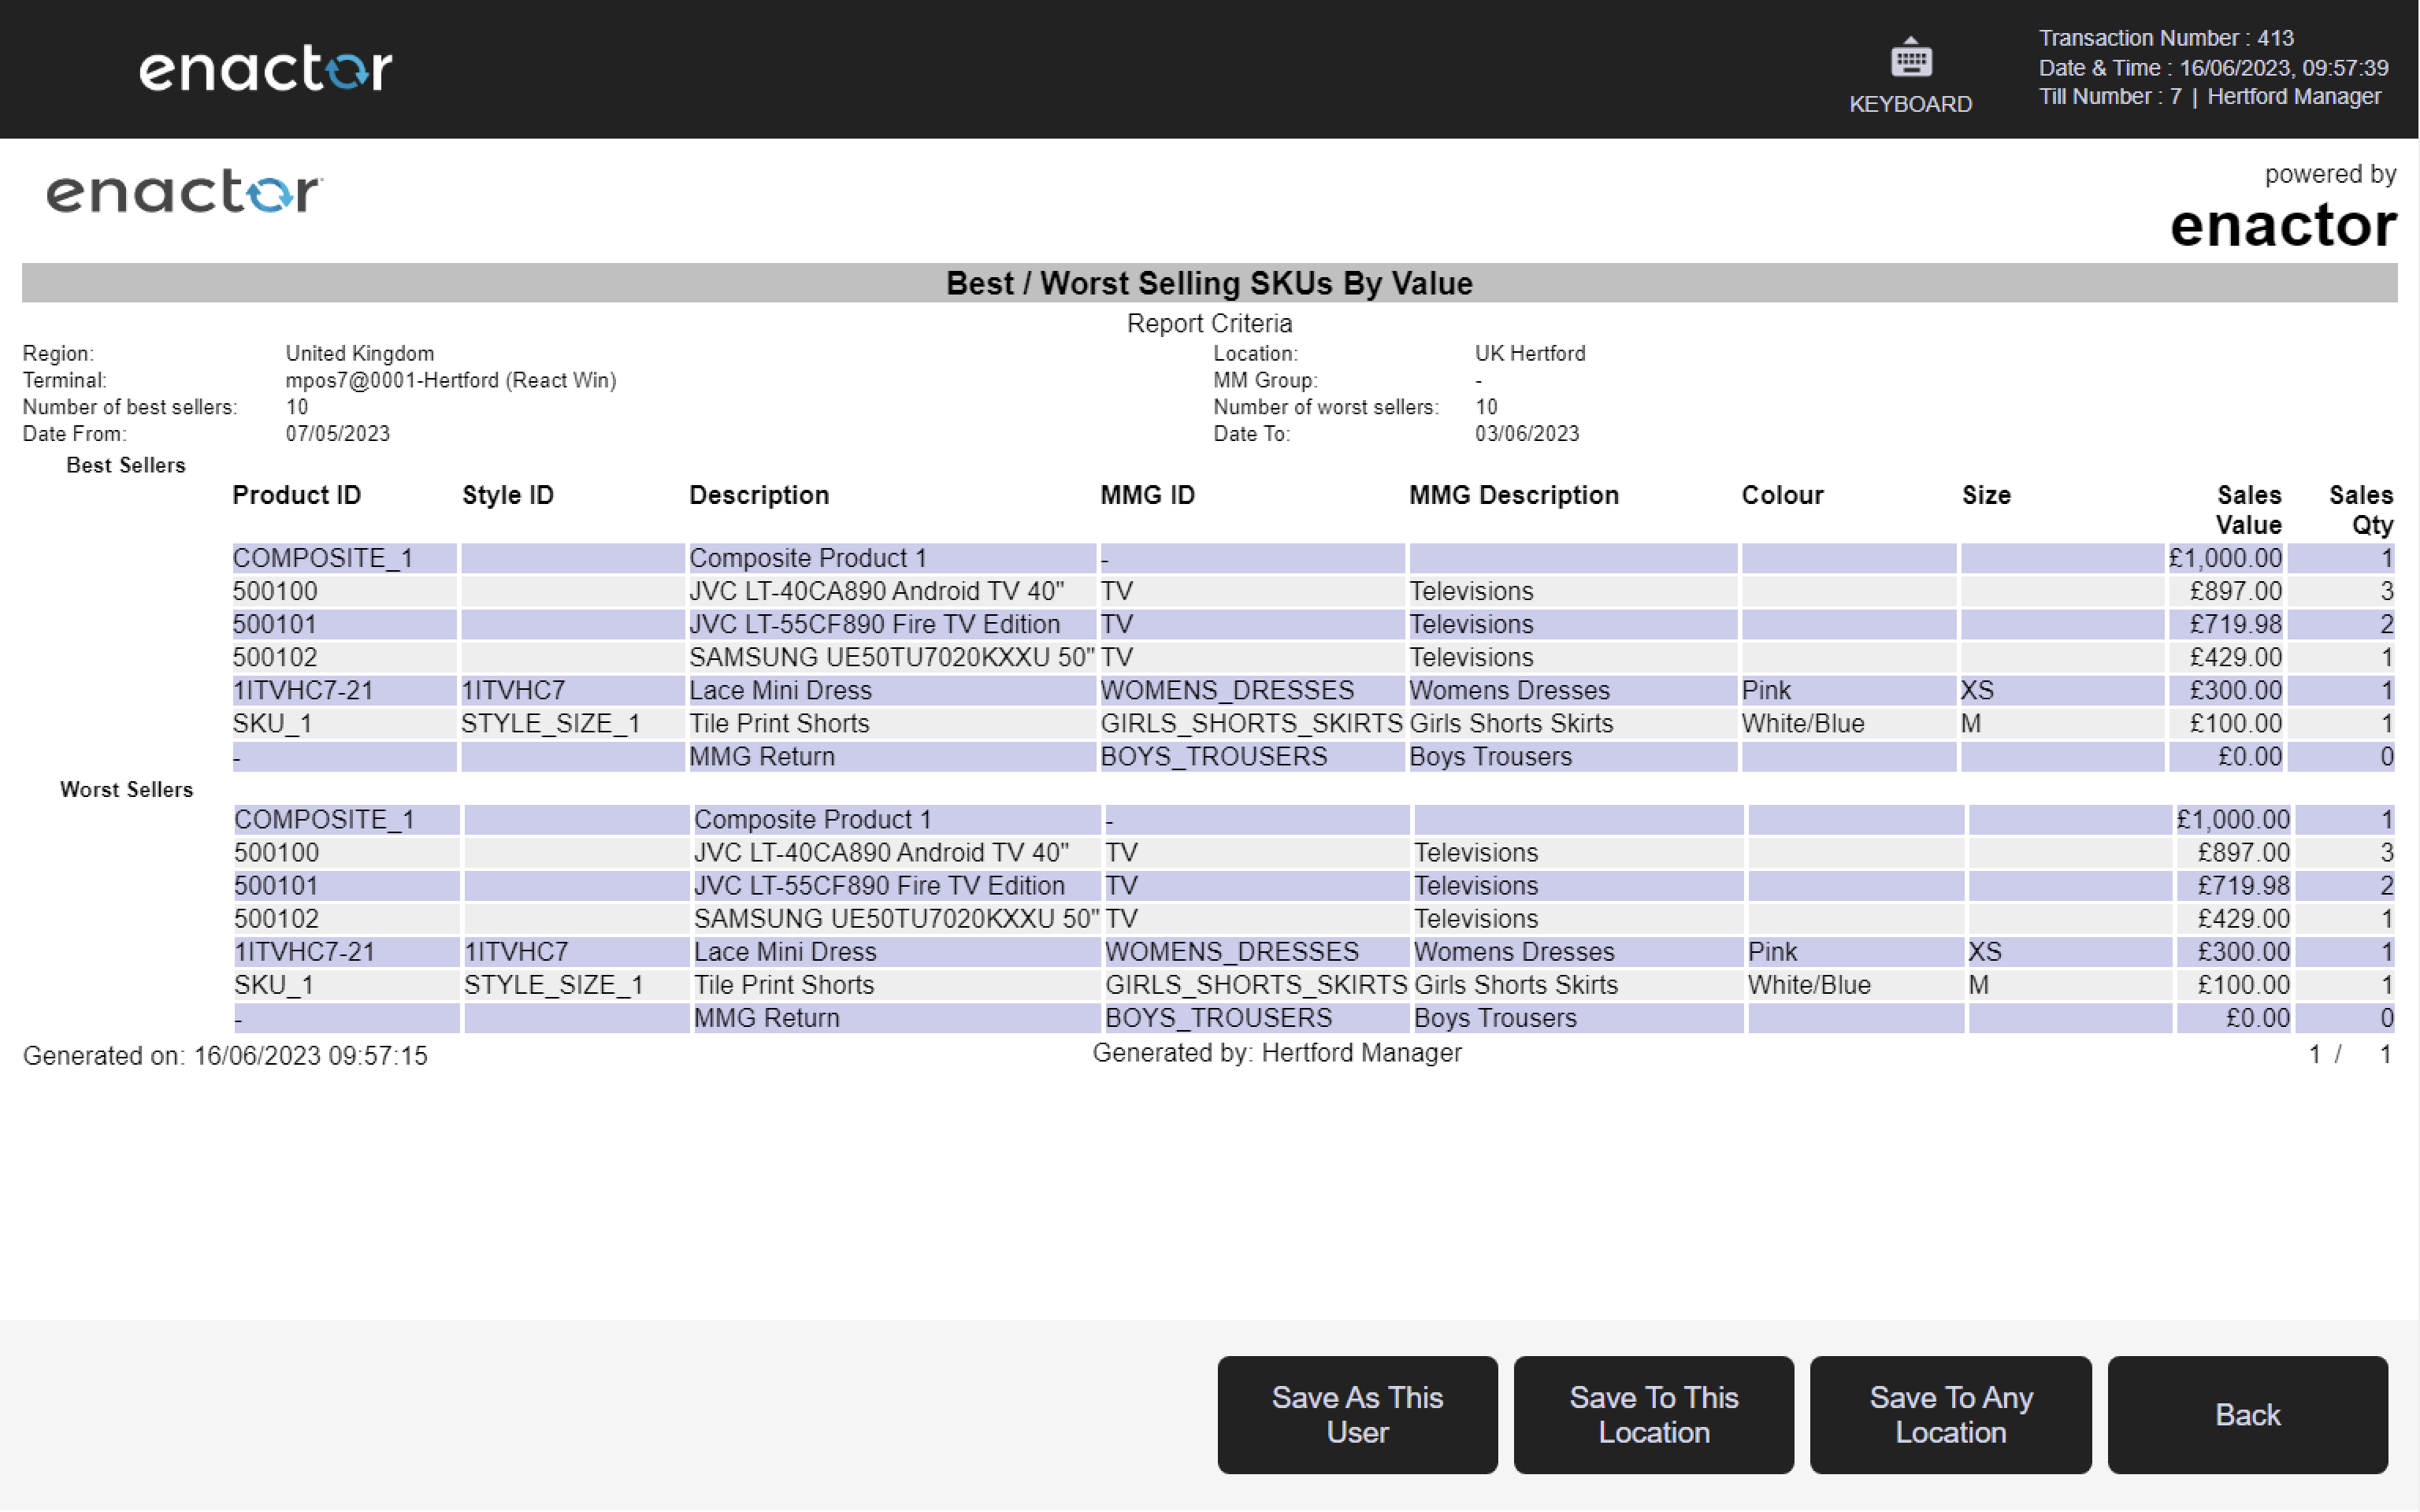
Output Columns
| Property | Description |
|---|---|
| Product ID | The unique identifier of the product. |
| Style ID | The style identifier associated with the product. |
| Description | The product description. |
| MMG ID | The merchandise management group identifier. |
| MMG Description | The description of the merchandise management group. |
| Colour | The colour variant of the product. |
| Size | The size variant of the product. |
| Sales Value | The total sales value for the product within the selected period. |
| Sales Qty | The total sales quantity for the product within the selected period. |
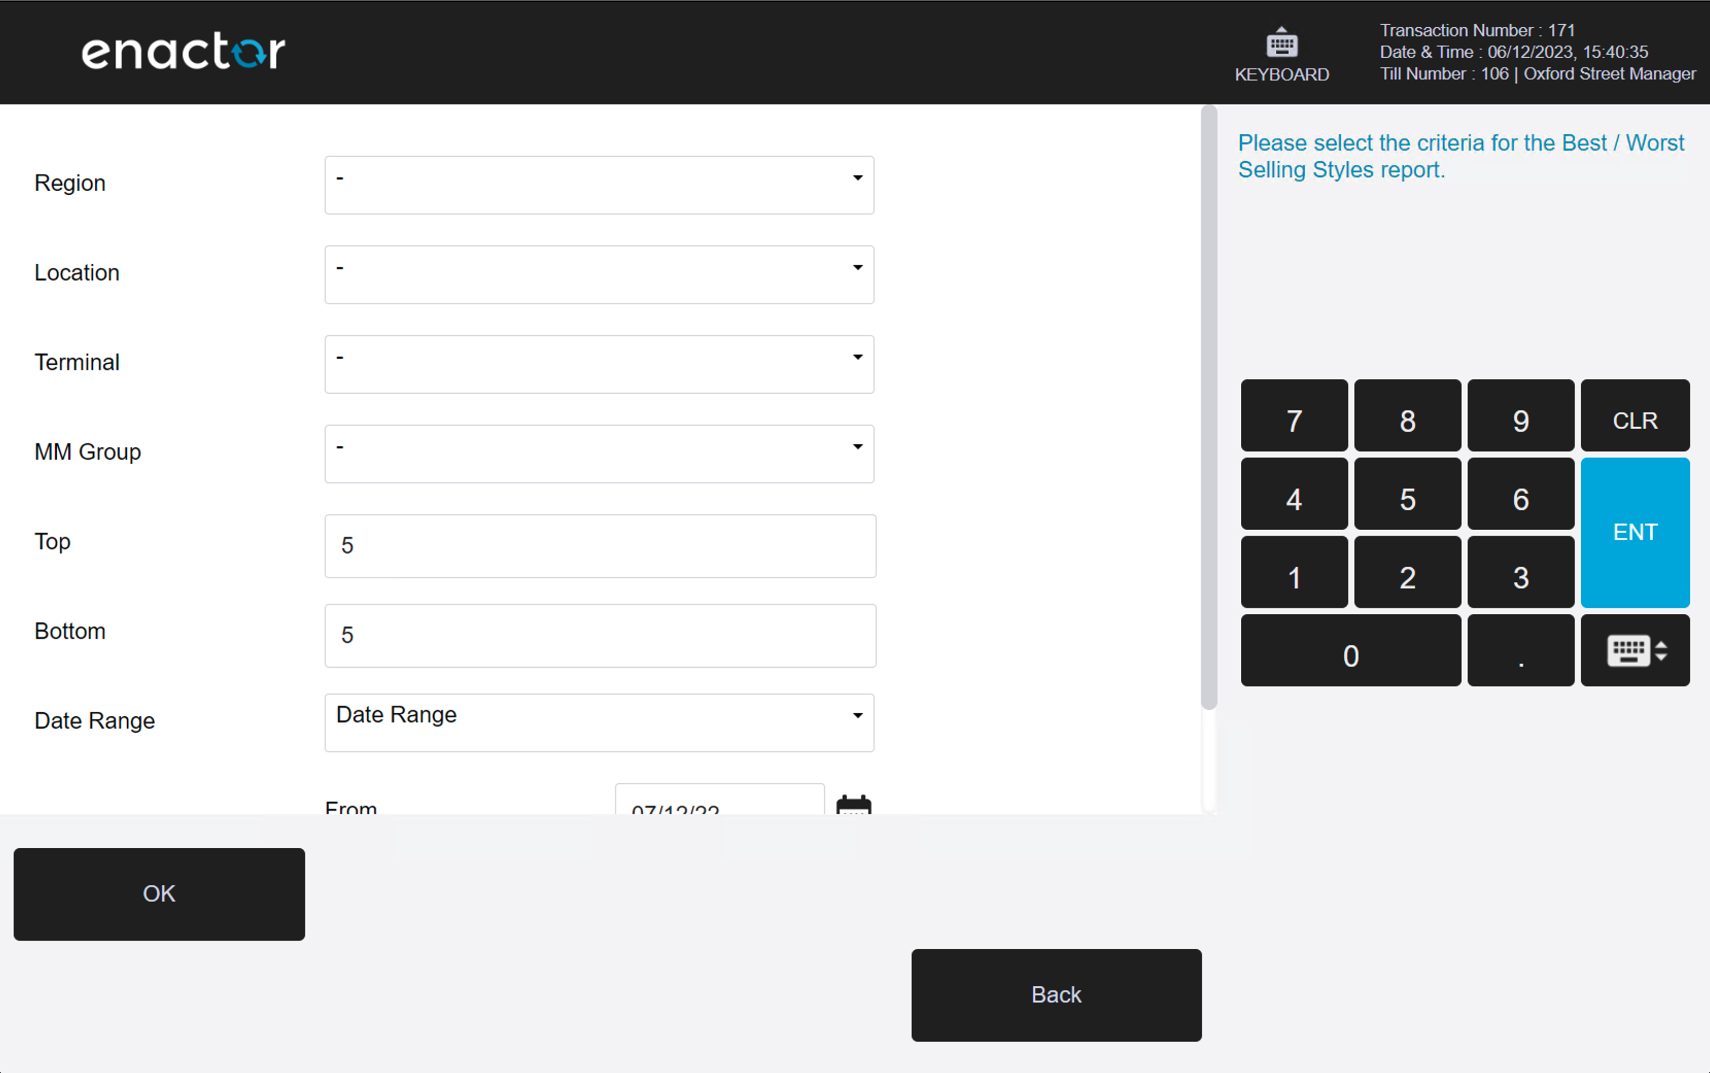
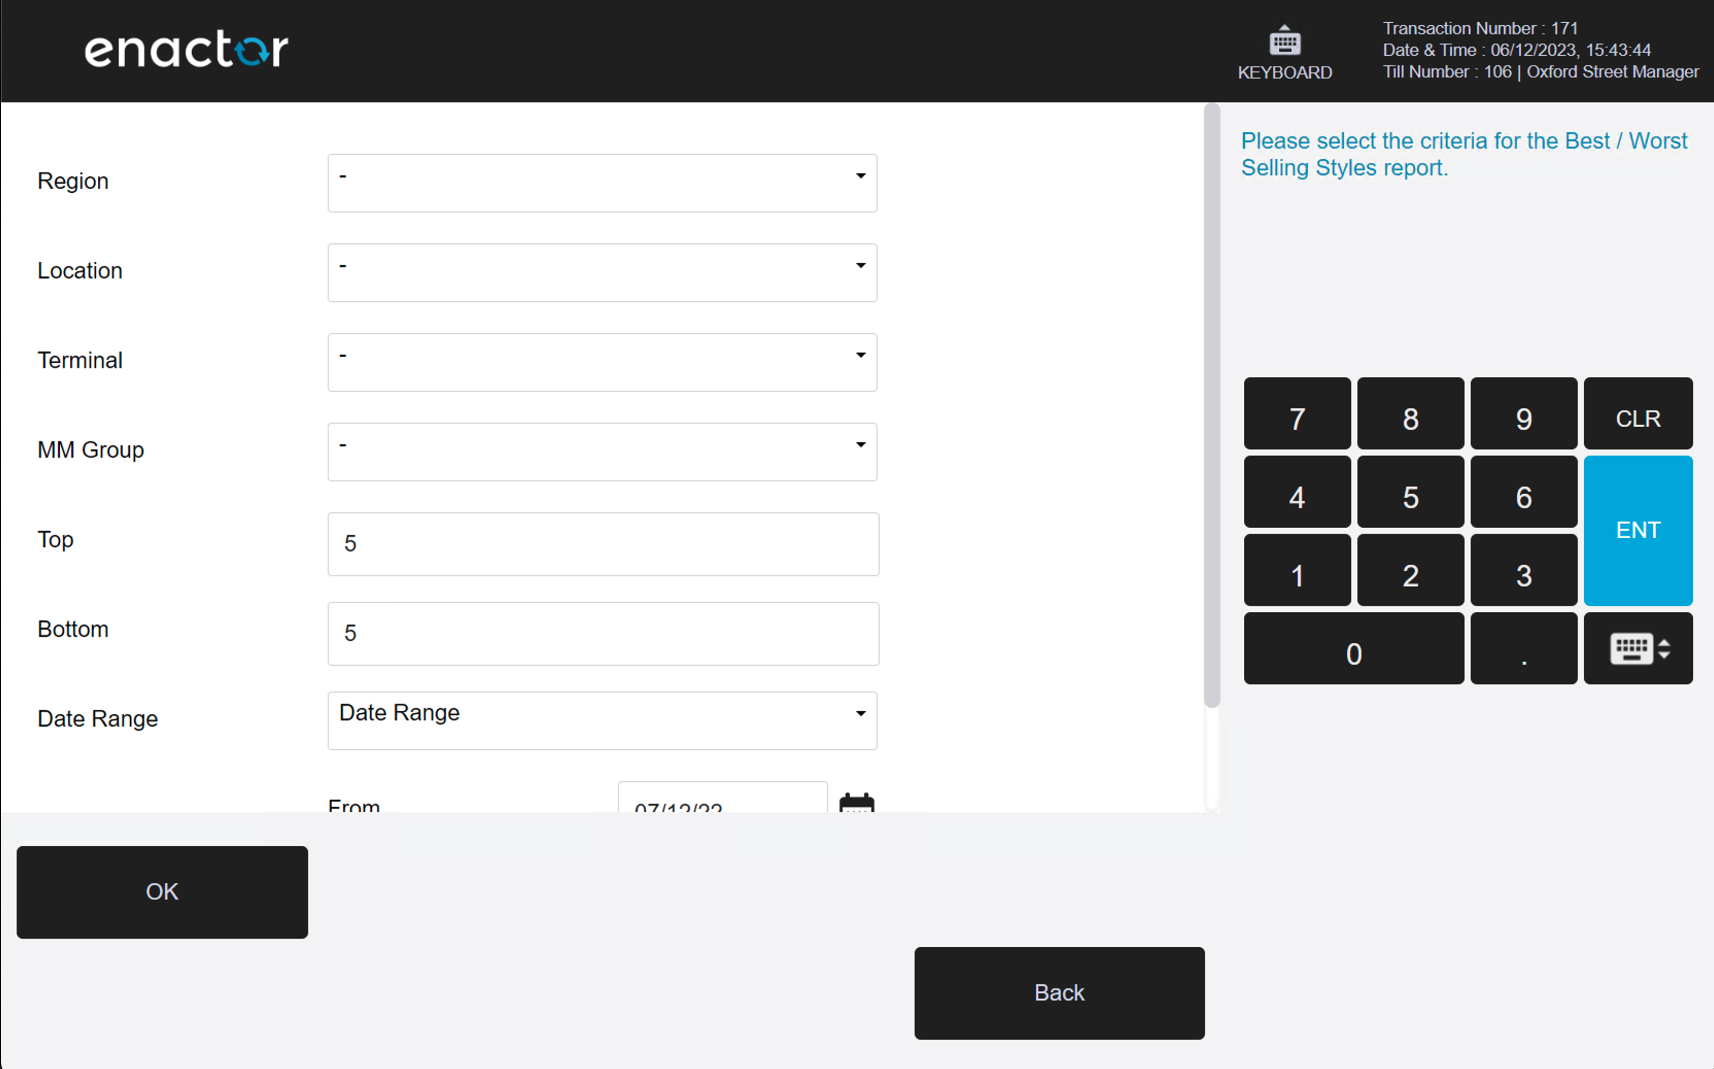
1.1.3 Best / Worst Selling Styles by Units
Path: Best / Worst Sellers > Best / Worst Selling Styles by Units
View best/worst selling styles by units.
Filter Criteria
| Property | Description |
|---|---|
| Region | Dropdown selection of available regions. |
| Location | Dropdown selection of locations, filtered by the selected region. |
| Terminal | Dropdown selection of terminals, filtered by the selected location. |
| MM Group | Dropdown selection of merchandise management group. |
| Top | Numeric input for the number of top-selling styles to display (default: 10). |
| Bottom | Numeric input for the number of worst-selling styles to display (default: 10). |
| Date Range | Date range selector: Date Range / Month in Year / Week in Year / Season / Quarter, with year, month/week/season/quarter, and from/to date inputs. |
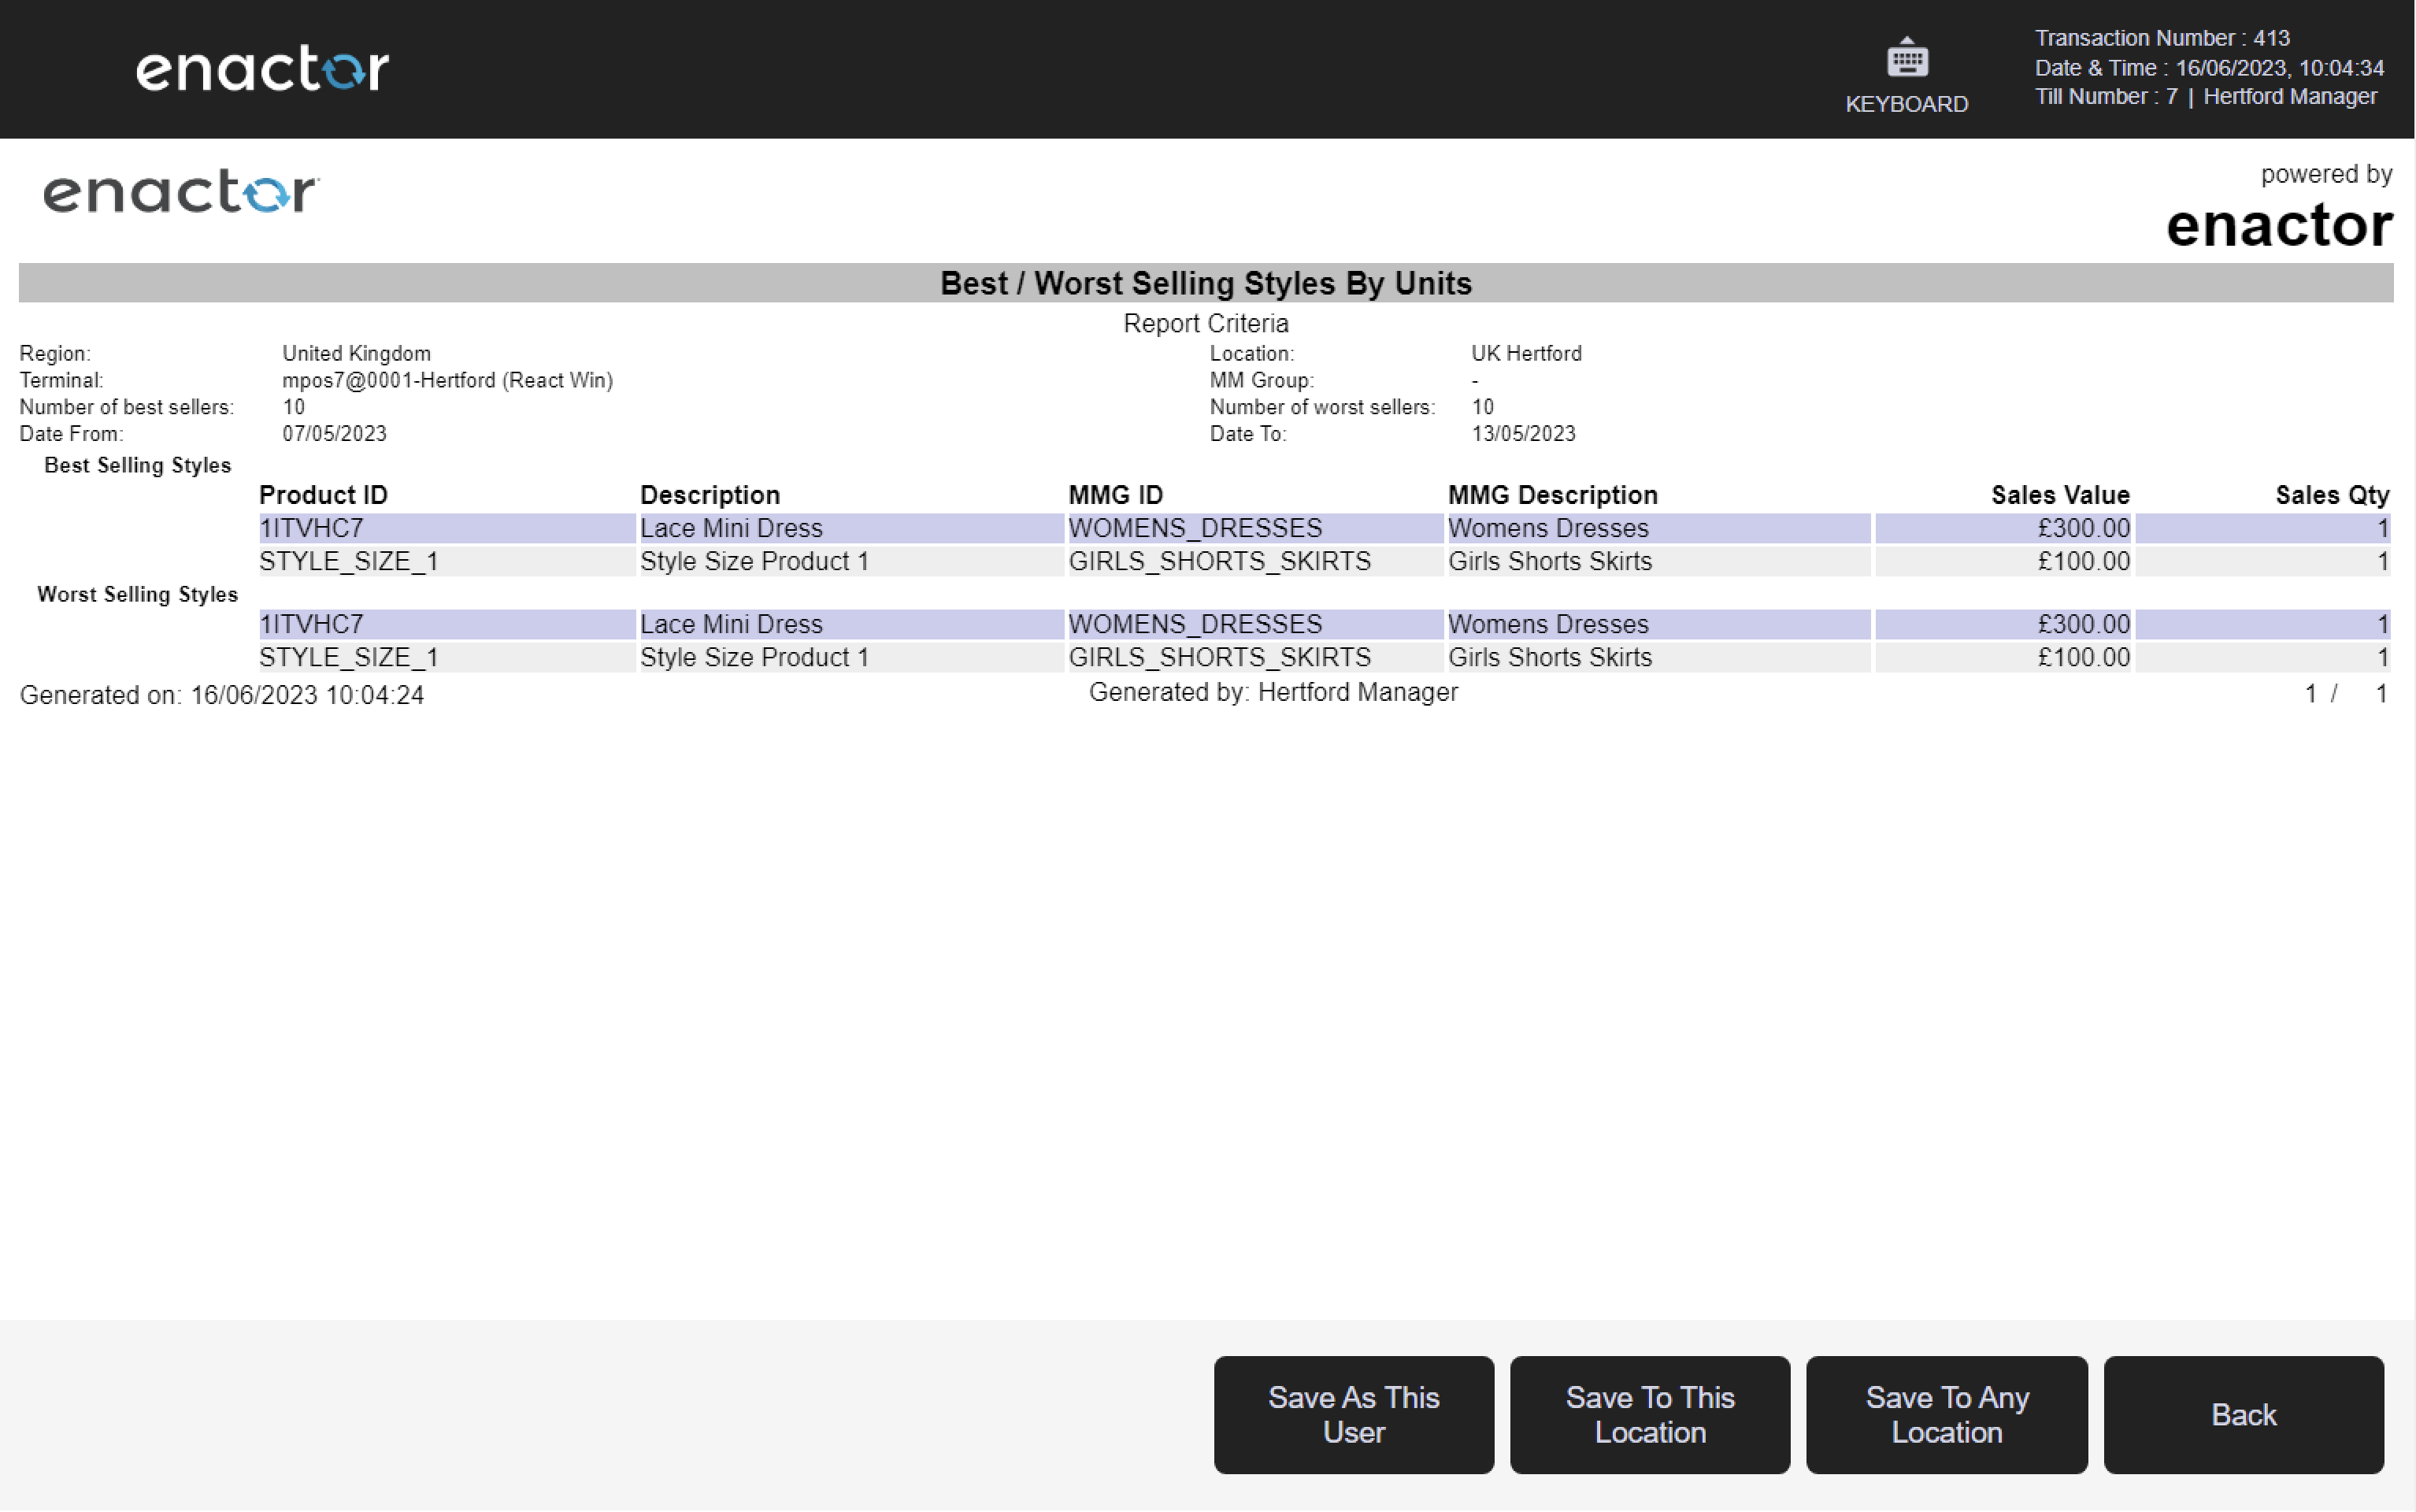
Output Columns
| Property | Description |
|---|---|
| Product ID | The unique identifier of the product style. |
| Description | The style description. |
| MMG ID | The merchandise management group identifier. |
| MMG Description | The description of the merchandise management group. |
| Sales Value | The total sales value for the style within the selected period. |
| Sales Qty | The total sales quantity for the style within the selected period. |
1.1.4 Best / Worst Selling Styles by Value
Path: Best / Worst Sellers > Best / Worst Selling Styles by Value
View best/worst selling styles by value.
Filter Criteria
| Property | Description |
|---|---|
| Region | Dropdown selection of available regions. |
| Location | Dropdown selection of locations, filtered by the selected region. |
| Terminal | Dropdown selection of terminals, filtered by the selected location. |
| MM Group | Dropdown selection of merchandise management group. |
| Top | Numeric input for the number of top-selling styles to display (default: 10). |
| Bottom | Numeric input for the number of worst-selling styles to display (default: 10). |
| Date Range | Date range selector: Date Range / Month in Year / Week in Year / Season / Quarter, with year, month/week/season/quarter, and from/to date inputs. |
Output Columns
| Property | Description |
|---|---|
| Product ID | The unique identifier of the product style. |
| Description | The style description. |
| MMG ID | The merchandise management group identifier. |
| MMG Description | The description of the merchandise management group. |
| Sales Value | The total sales value for the style within the selected period. |
| Sales Qty | The total sales quantity for the style within the selected period. |

1.2 MMG Reports
Path: Product Reports > MMG Reports
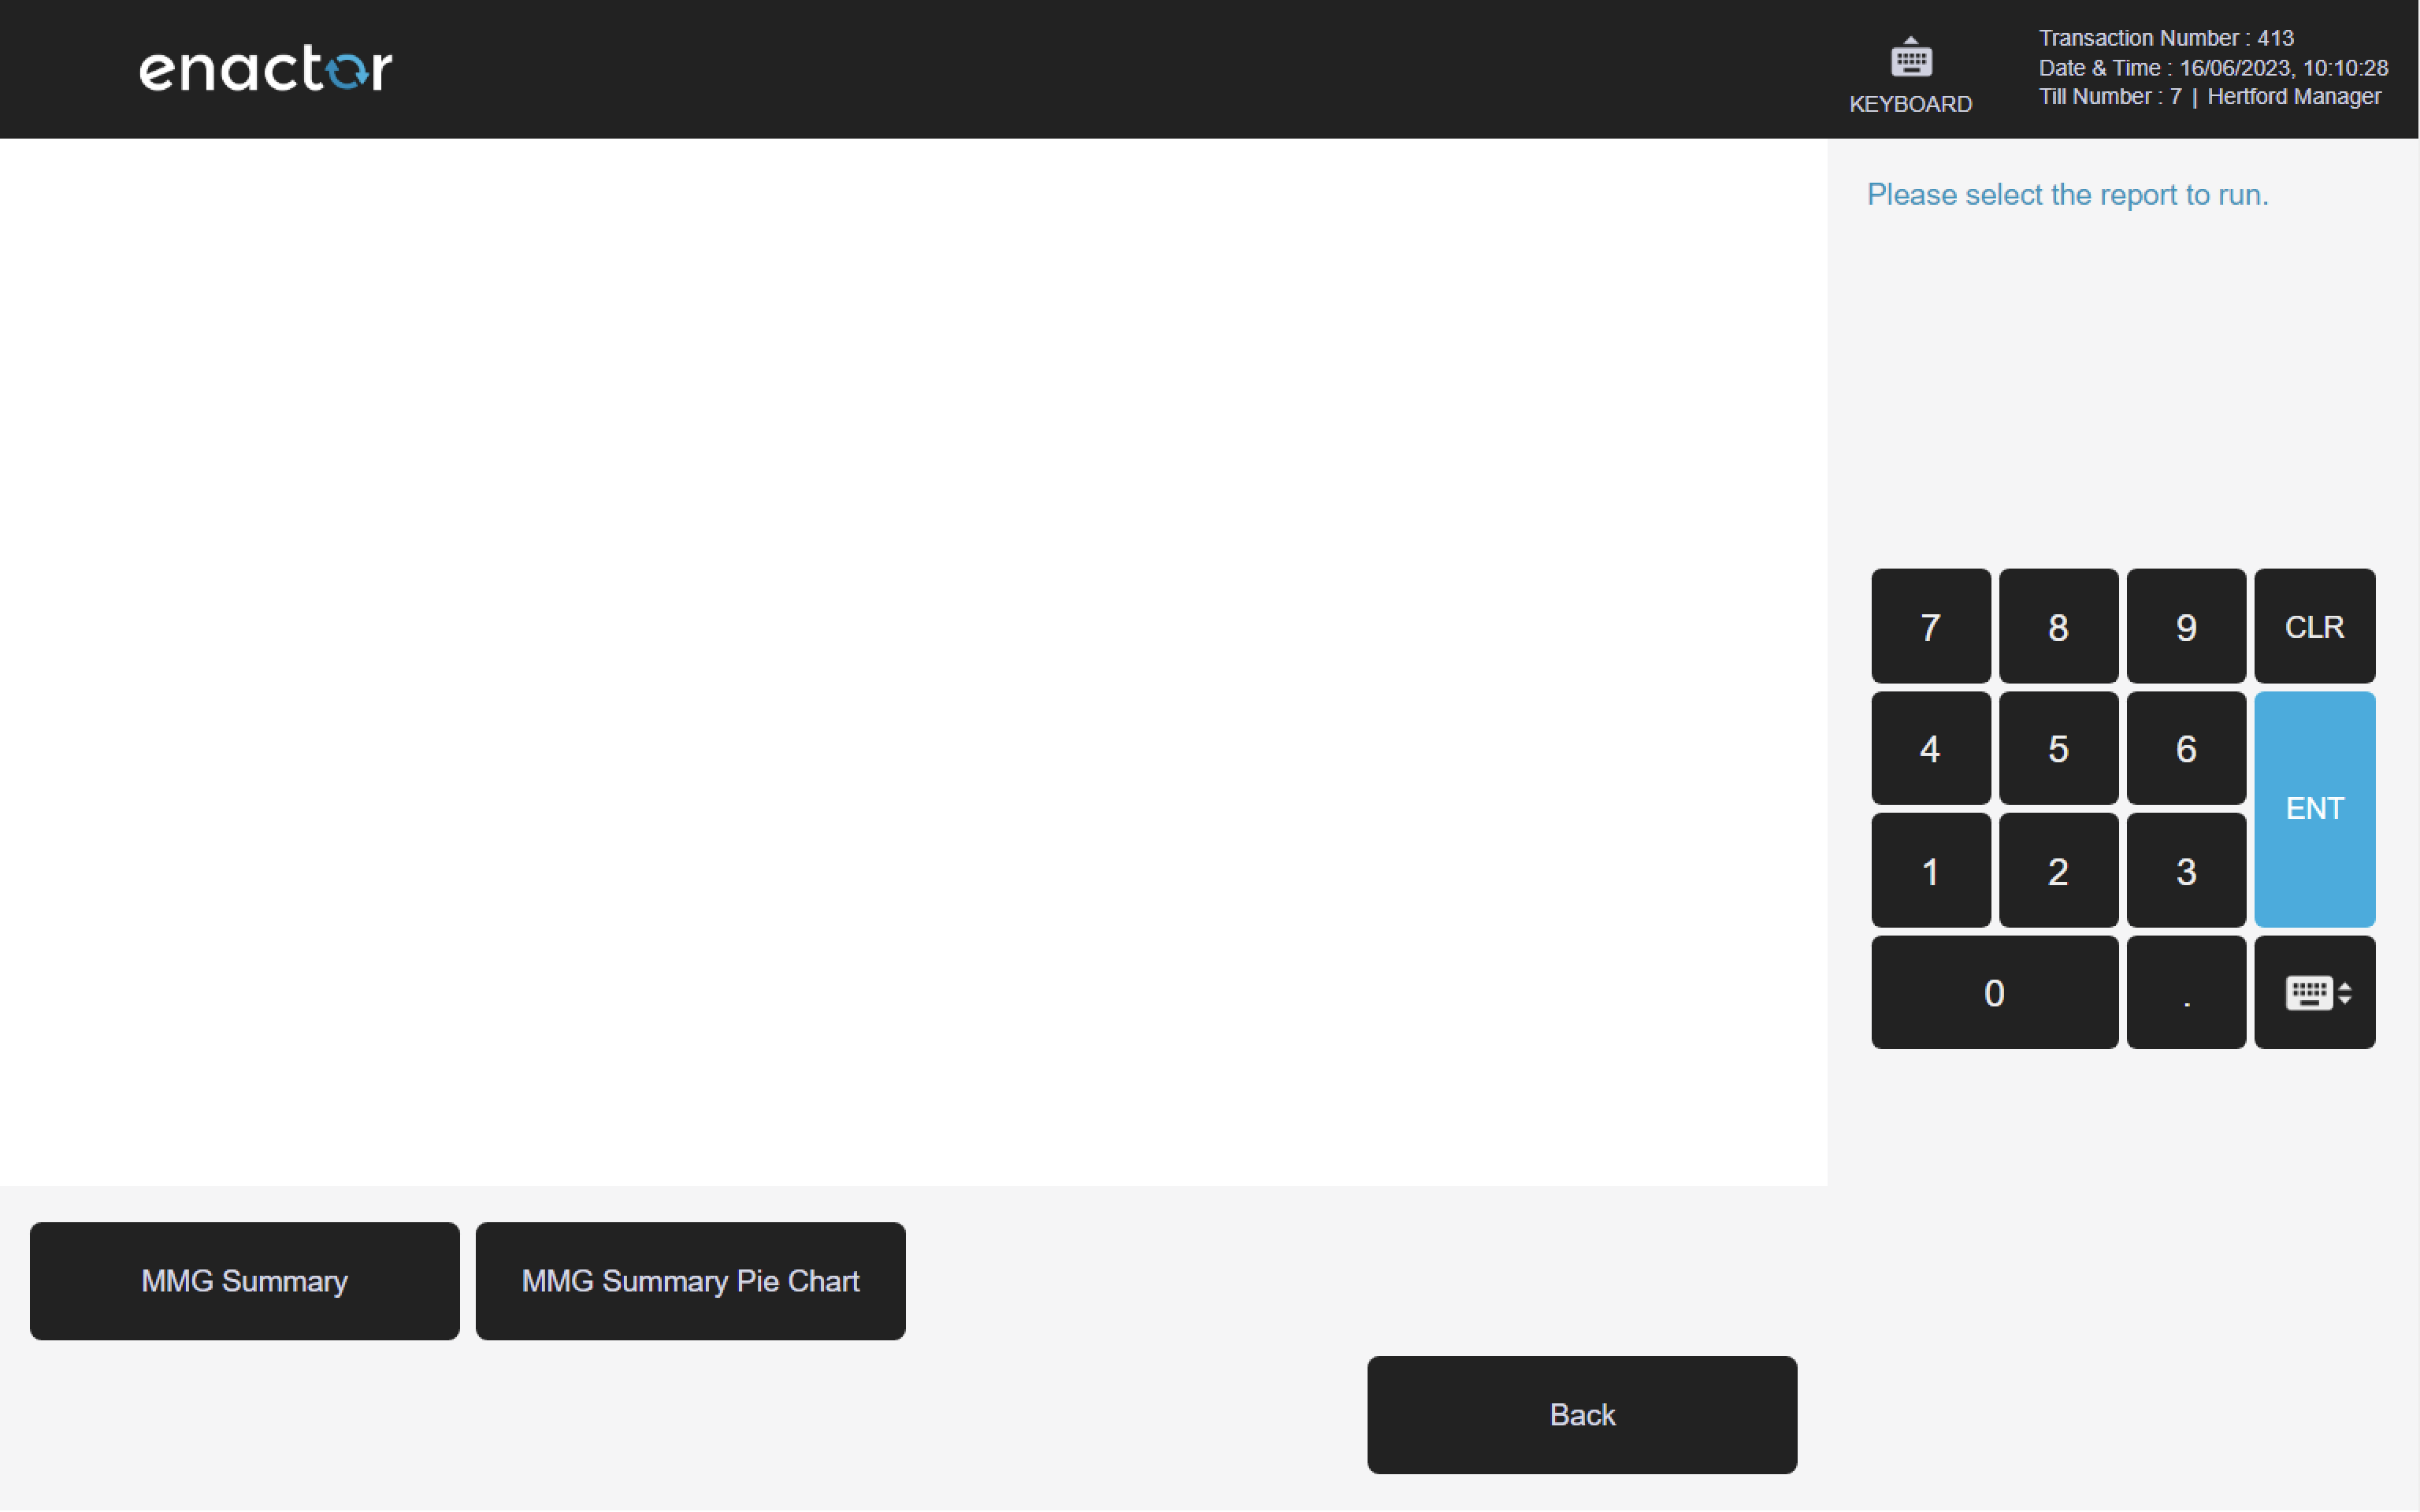
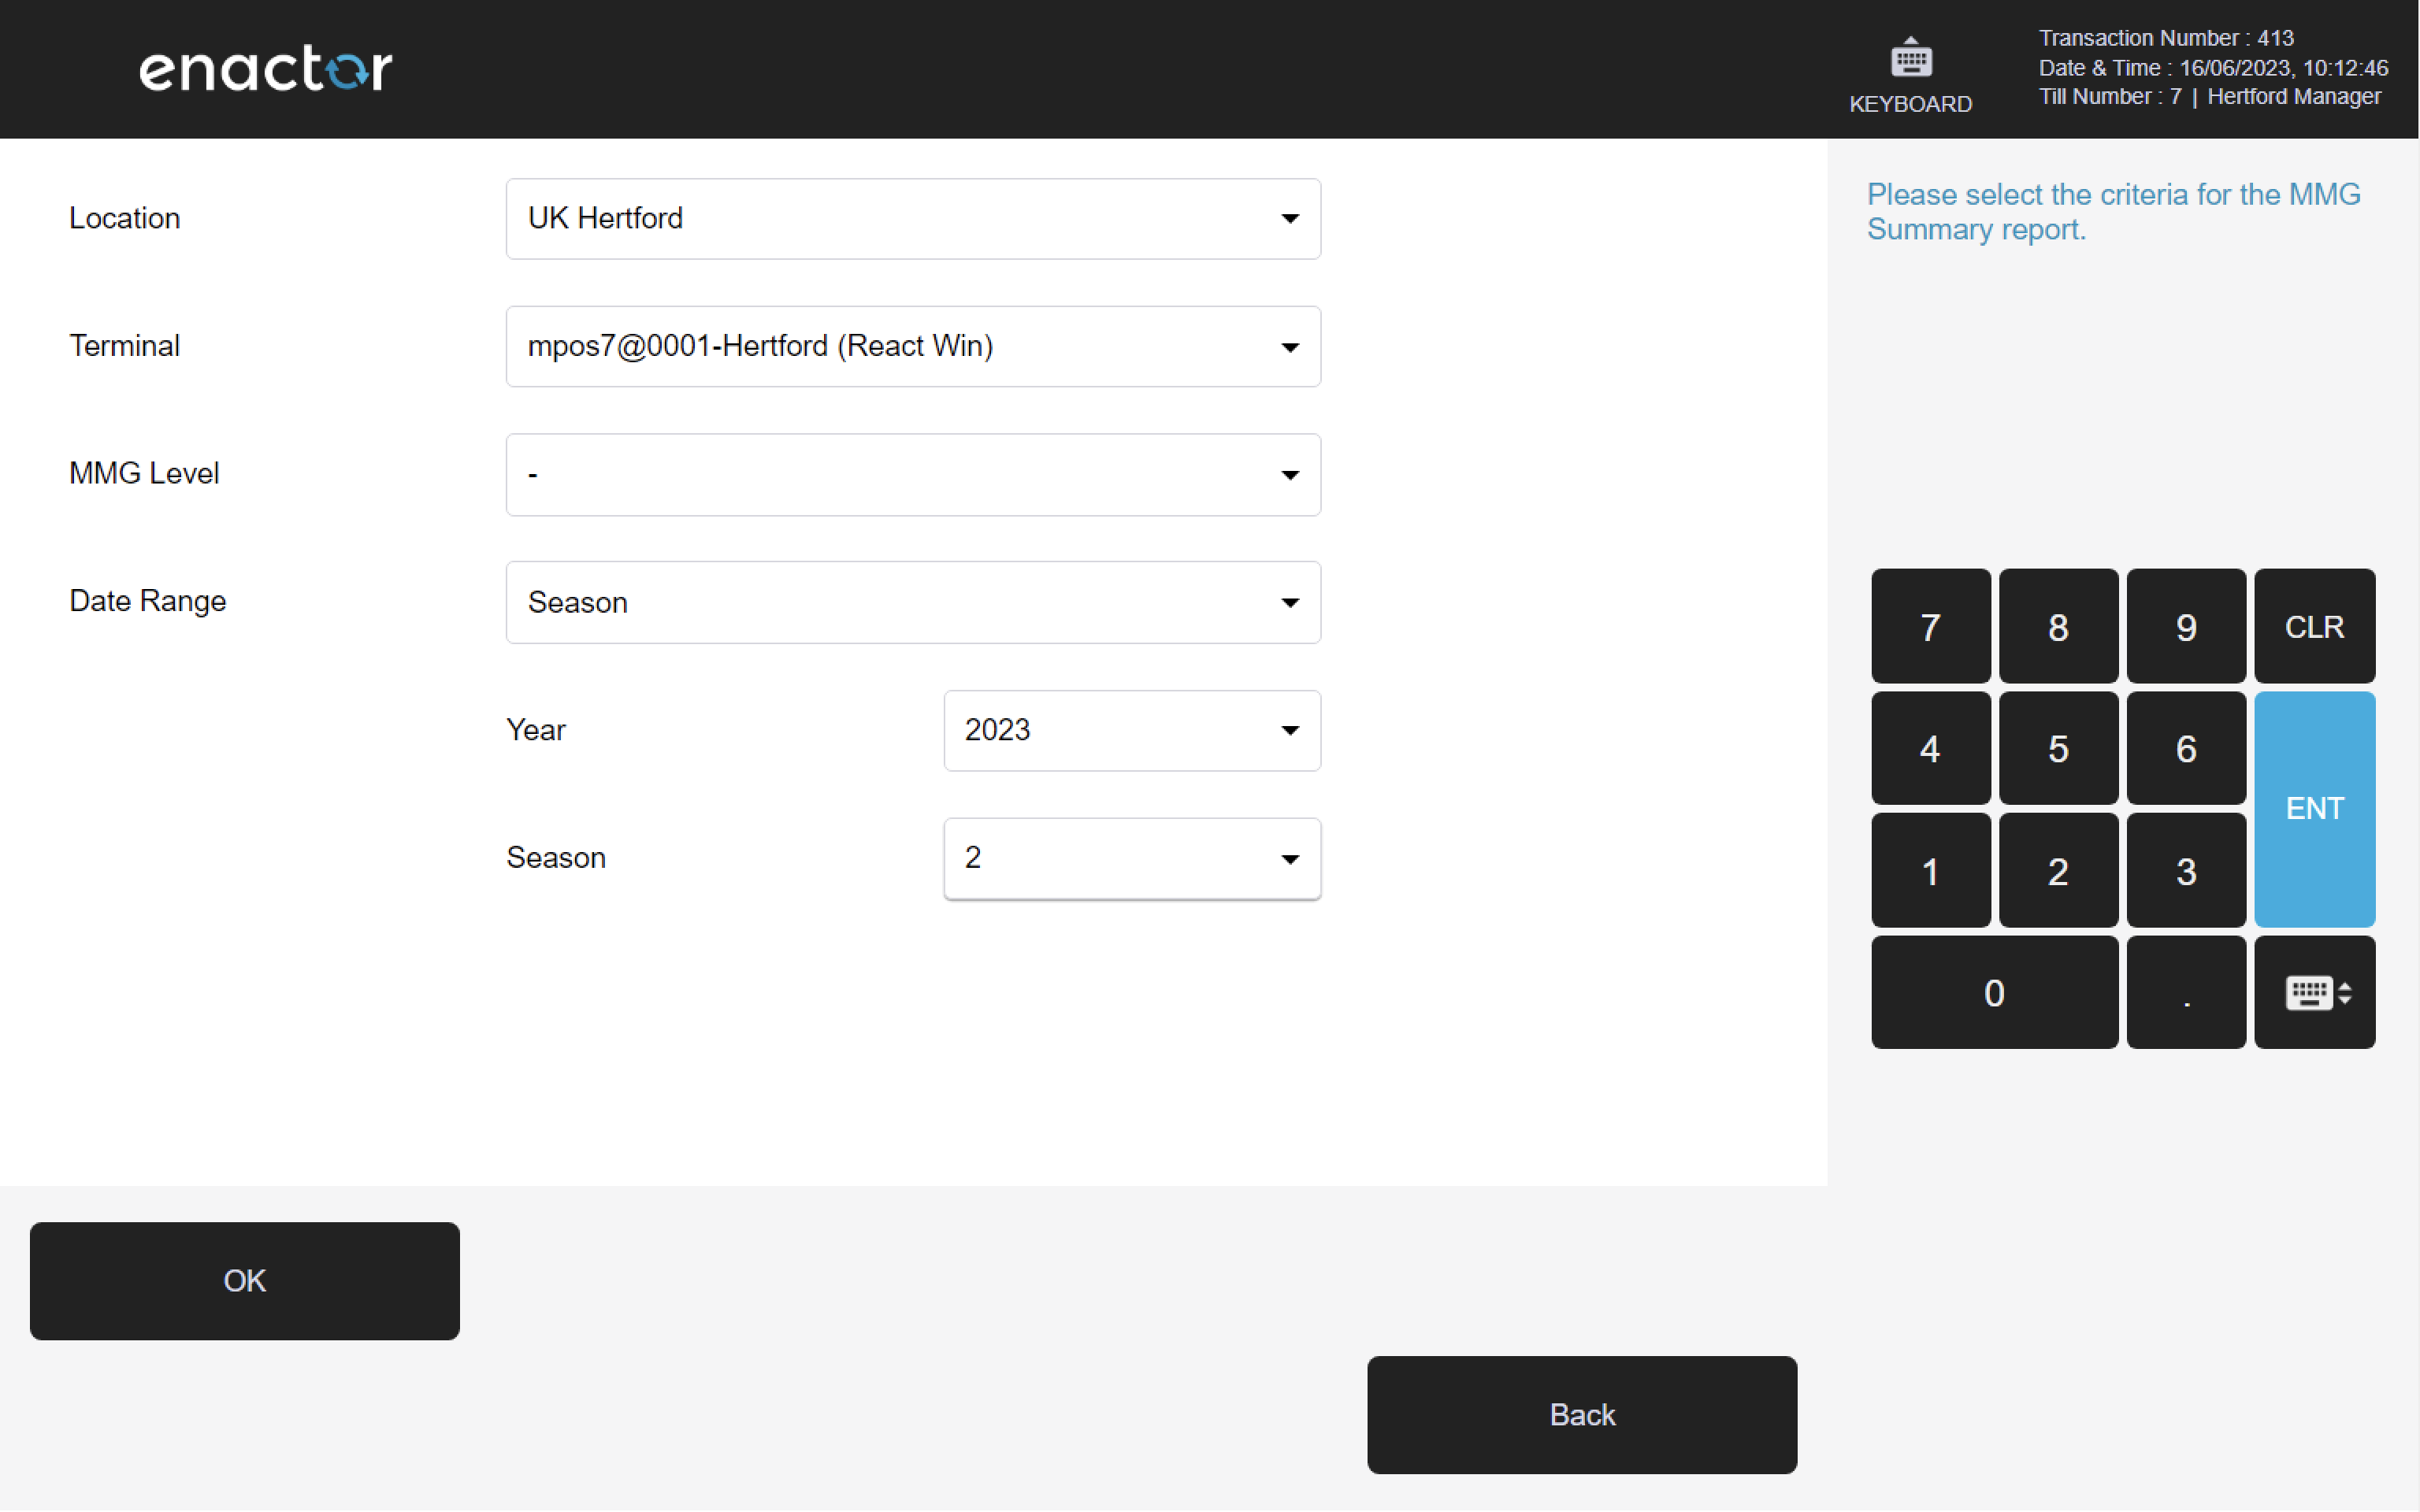
1.2.1 MMG Summary
Path: MMG Reports > MMG Summary
View MMG Summary information.
Filter Criteria
| Property | Description |
|---|---|
| Location | Dropdown selection of available locations. |
| Terminal | Dropdown selection of terminals, filtered by the selected location. |
| MMG Level | Dropdown selection of merchandise management group level (levels 1-10). |
| Date Range | Date range selector with from/to date inputs. |
Output Columns
| Property | Description |
|---|---|
| MMG ID | The merchandise management group identifier. |
| MMG Description | The description of the merchandise management group. |
| Sales Value | The total sales value within the selected period. |
| Sales Qty | The total sales quantity within the selected period. |
| Orders Value | The total orders value within the selected period. |
| Orders Qty | The total orders quantity within the selected period. |
| Discounts Value | The total discounts value applied within the selected period. |
| Discount Qty | The total number of discount transactions within the selected period. |
| Promotions Value | The total promotions value applied within the selected period. |
| Price Overrides Value | The total value of price overrides within the selected period. |
| Returns Value | The total returns value within the selected period. |
| Returns Qty | The total returns quantity within the selected period. |
| % Returns of Total | Returns as a percentage of total sales. |
| Net Sales Value | The net sales value (sales minus returns) within the selected period. |
| Net Sales Qty | The net sales quantity (sales minus returns) within the selected period. |
| % Net Sales of Total | Net sales as a percentage of the overall total. |

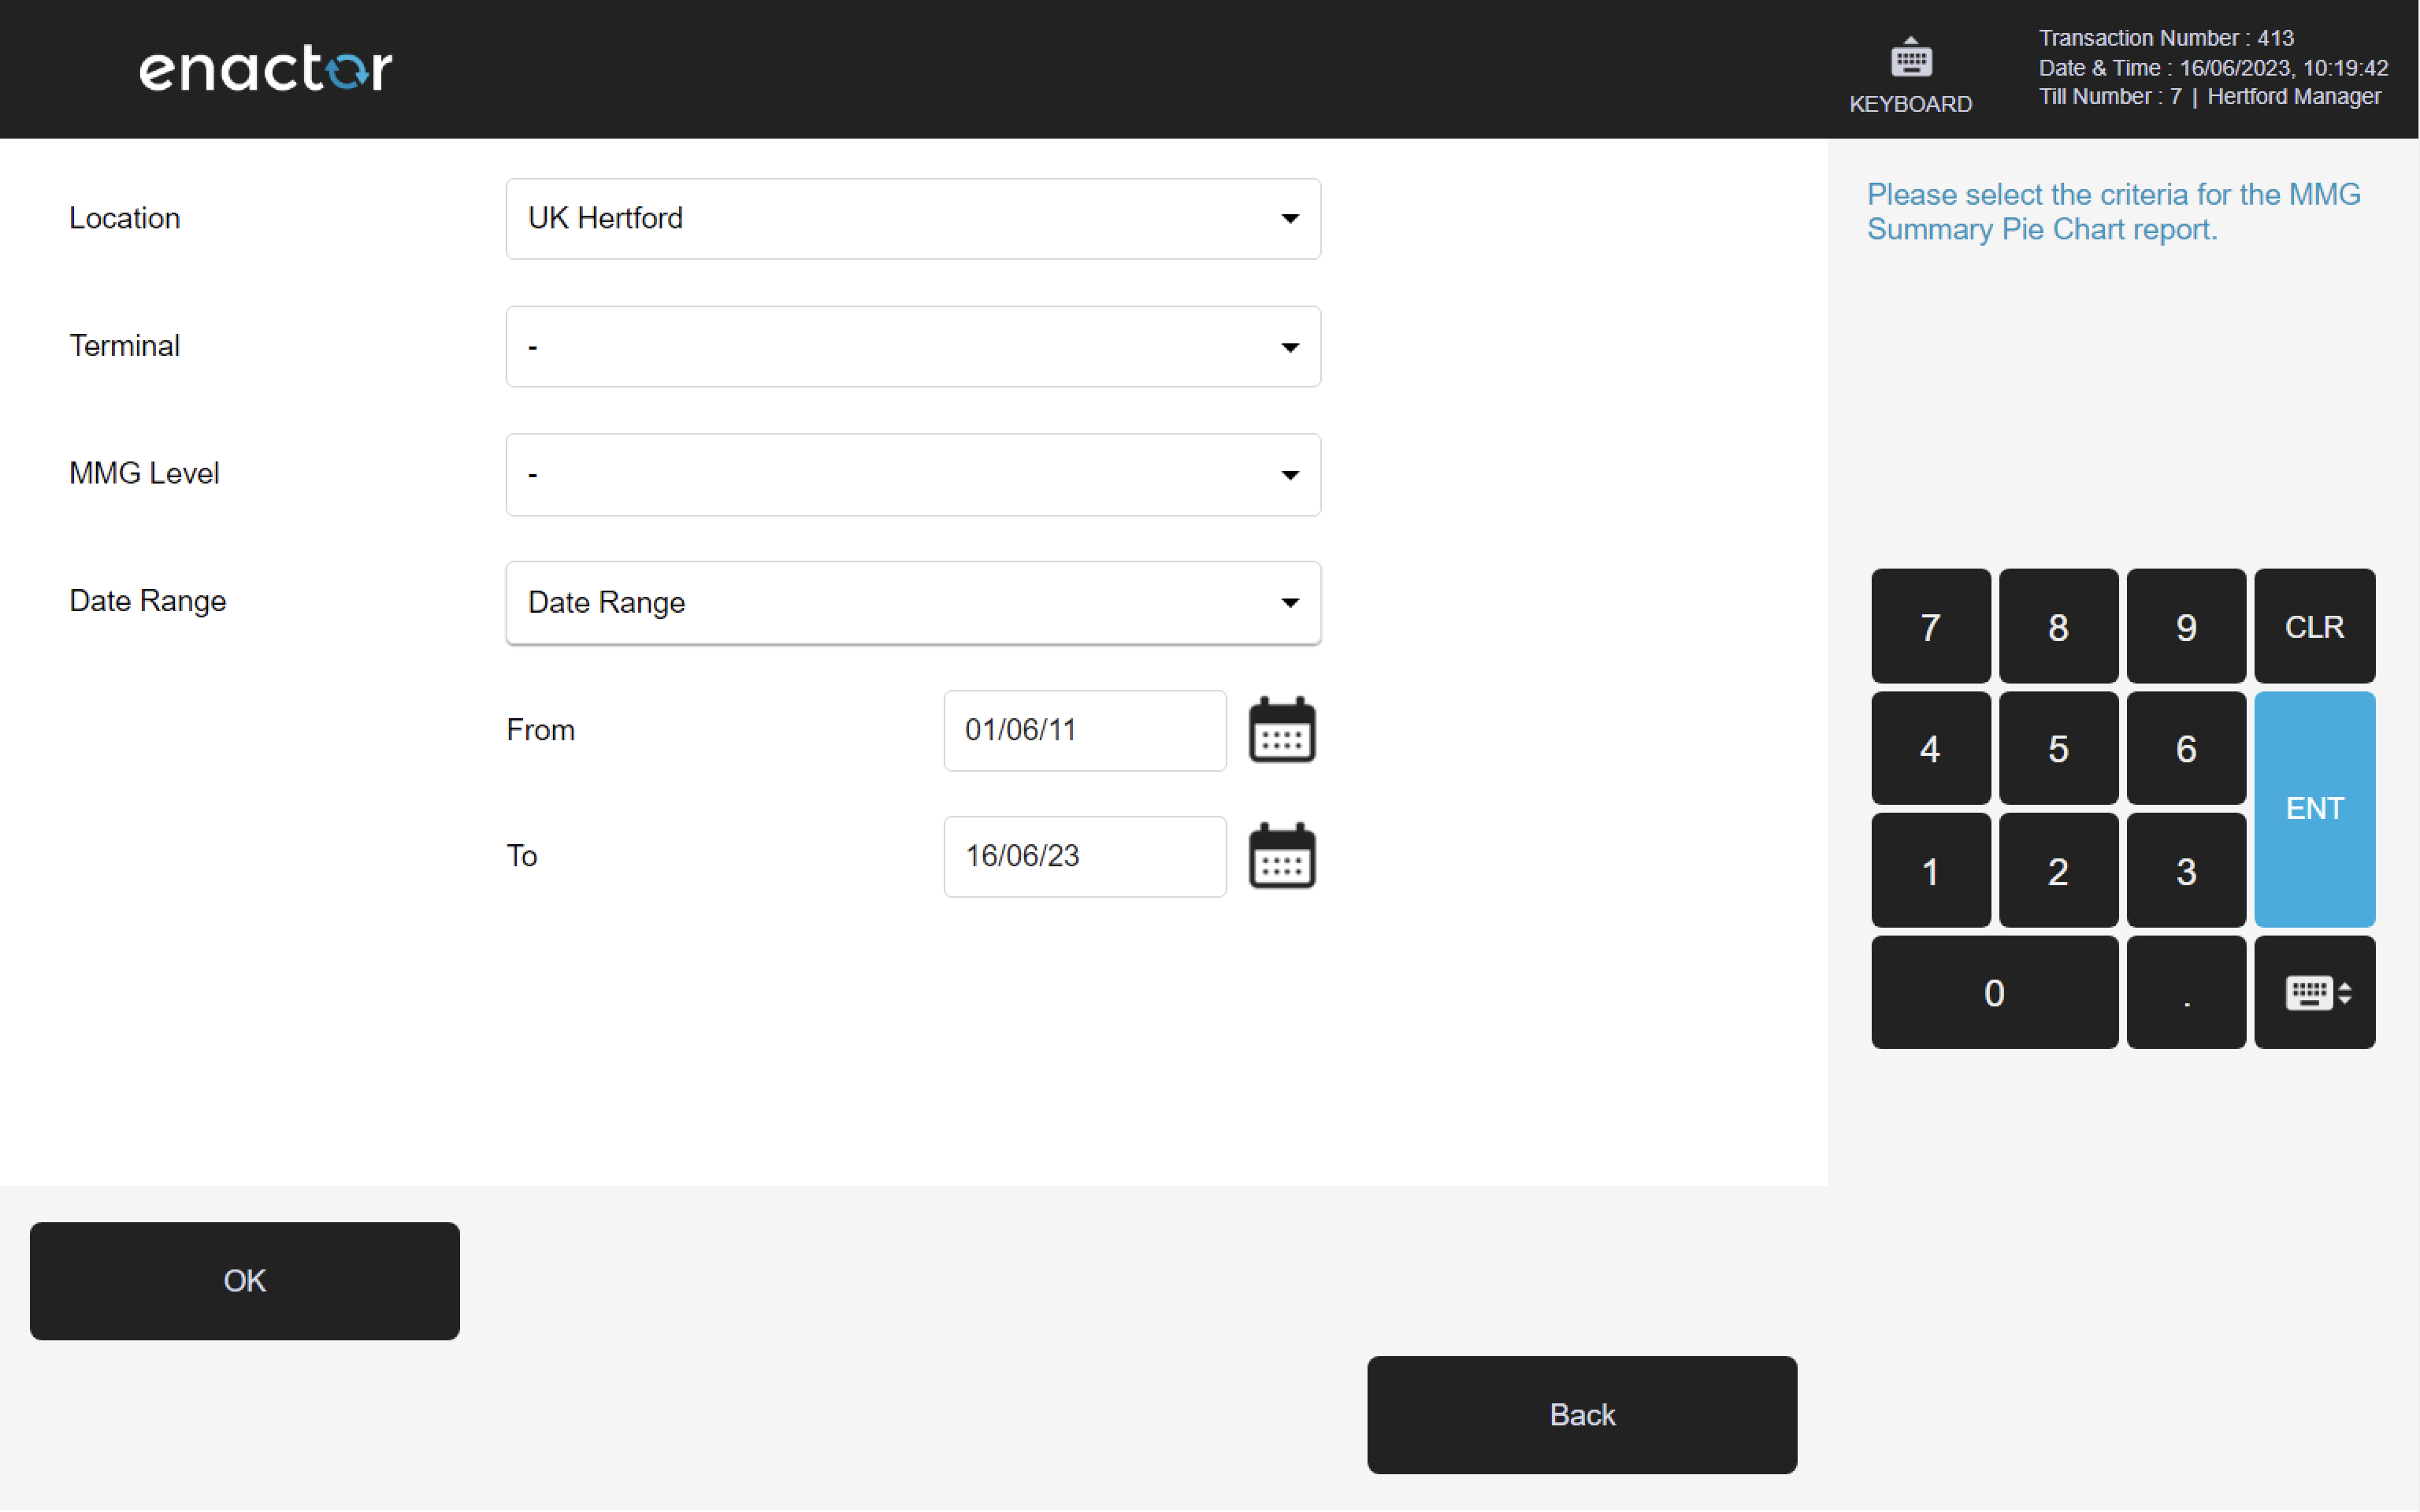
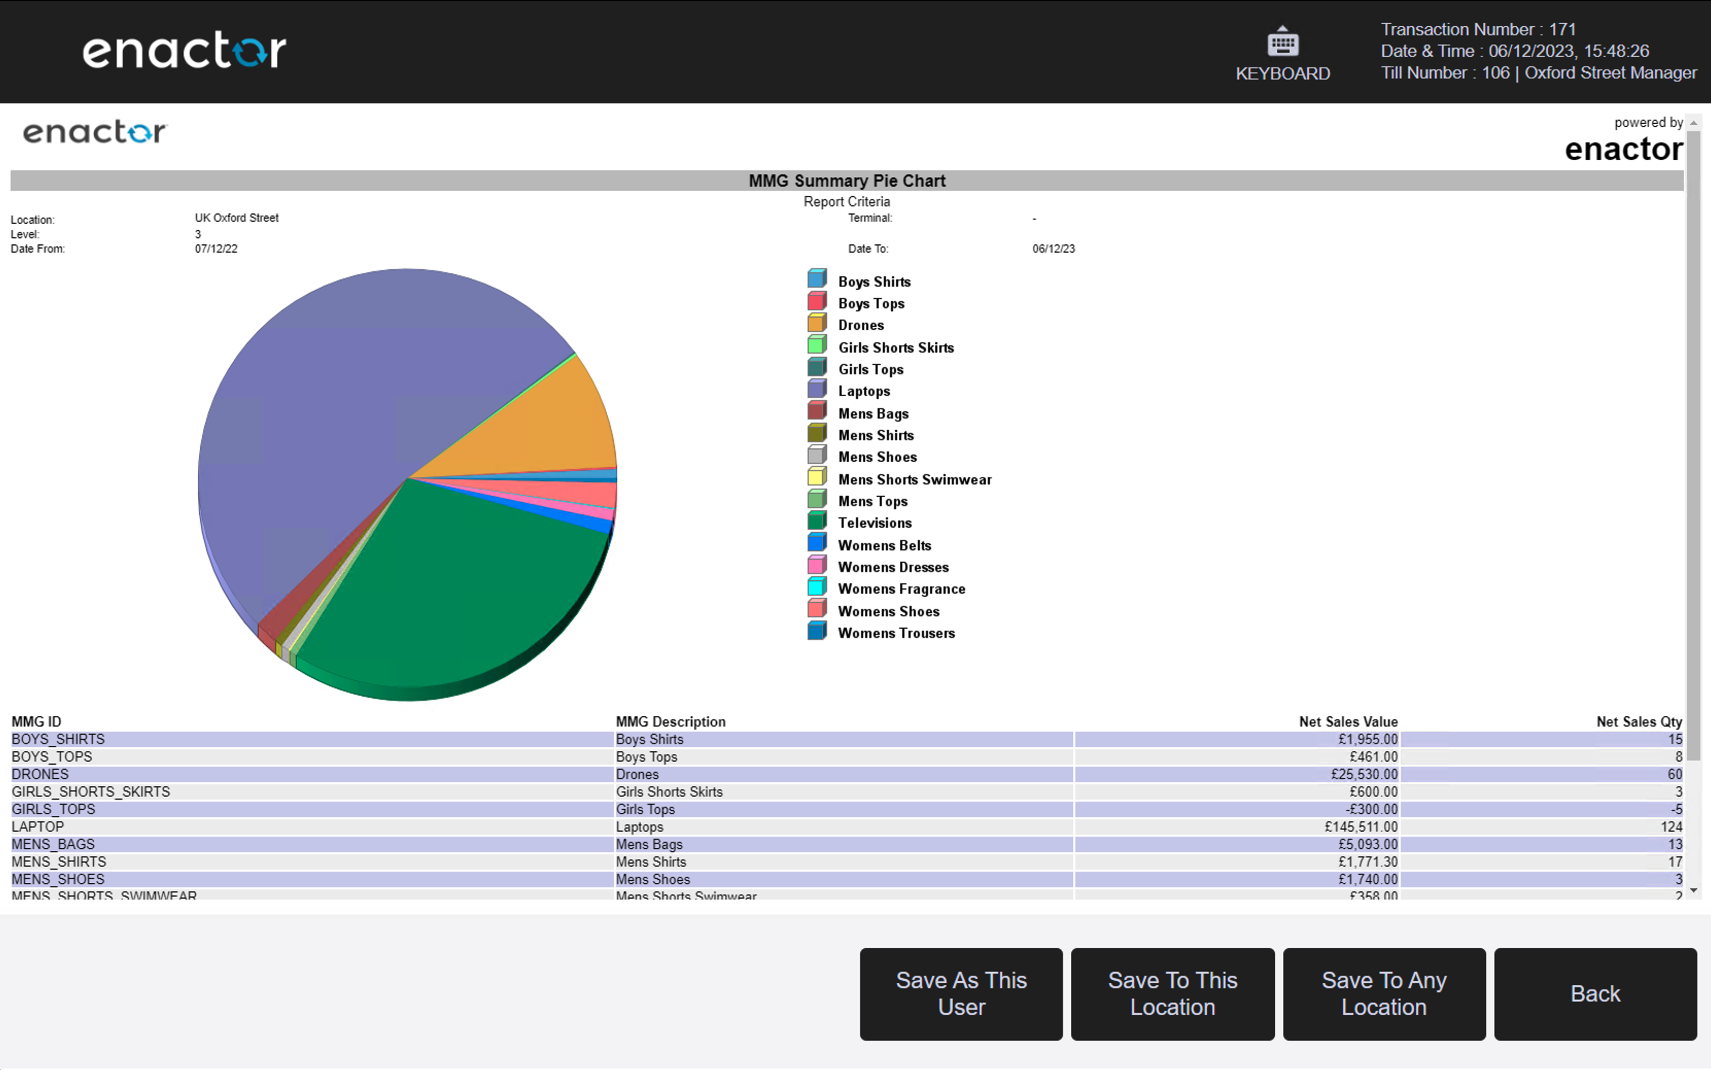
1.2.2 MMG Summary Pie Chart
Path: MMG Reports > MMG Summary Pie Chart
View MMG Summary information in pie chart form.
Filter Criteria
| Property | Description |
|---|---|
| Location | Dropdown selection of available locations. |
| Terminal | Dropdown selection of terminals, filtered by the selected location. |
| MMG Level | Dropdown selection of merchandise management group level (levels 1-10). |
| Date Range | Date range selector with from/to date inputs. |
Output Columns
| Property | Description |
|---|---|
| MMG ID | The merchandise management group identifier. |
| MMG Description | The description of the merchandise management group. |
| Net Sales Value | The net sales value for the group, represented in the pie chart. |
| Net Sales Qty | The net sales quantity for the group. |
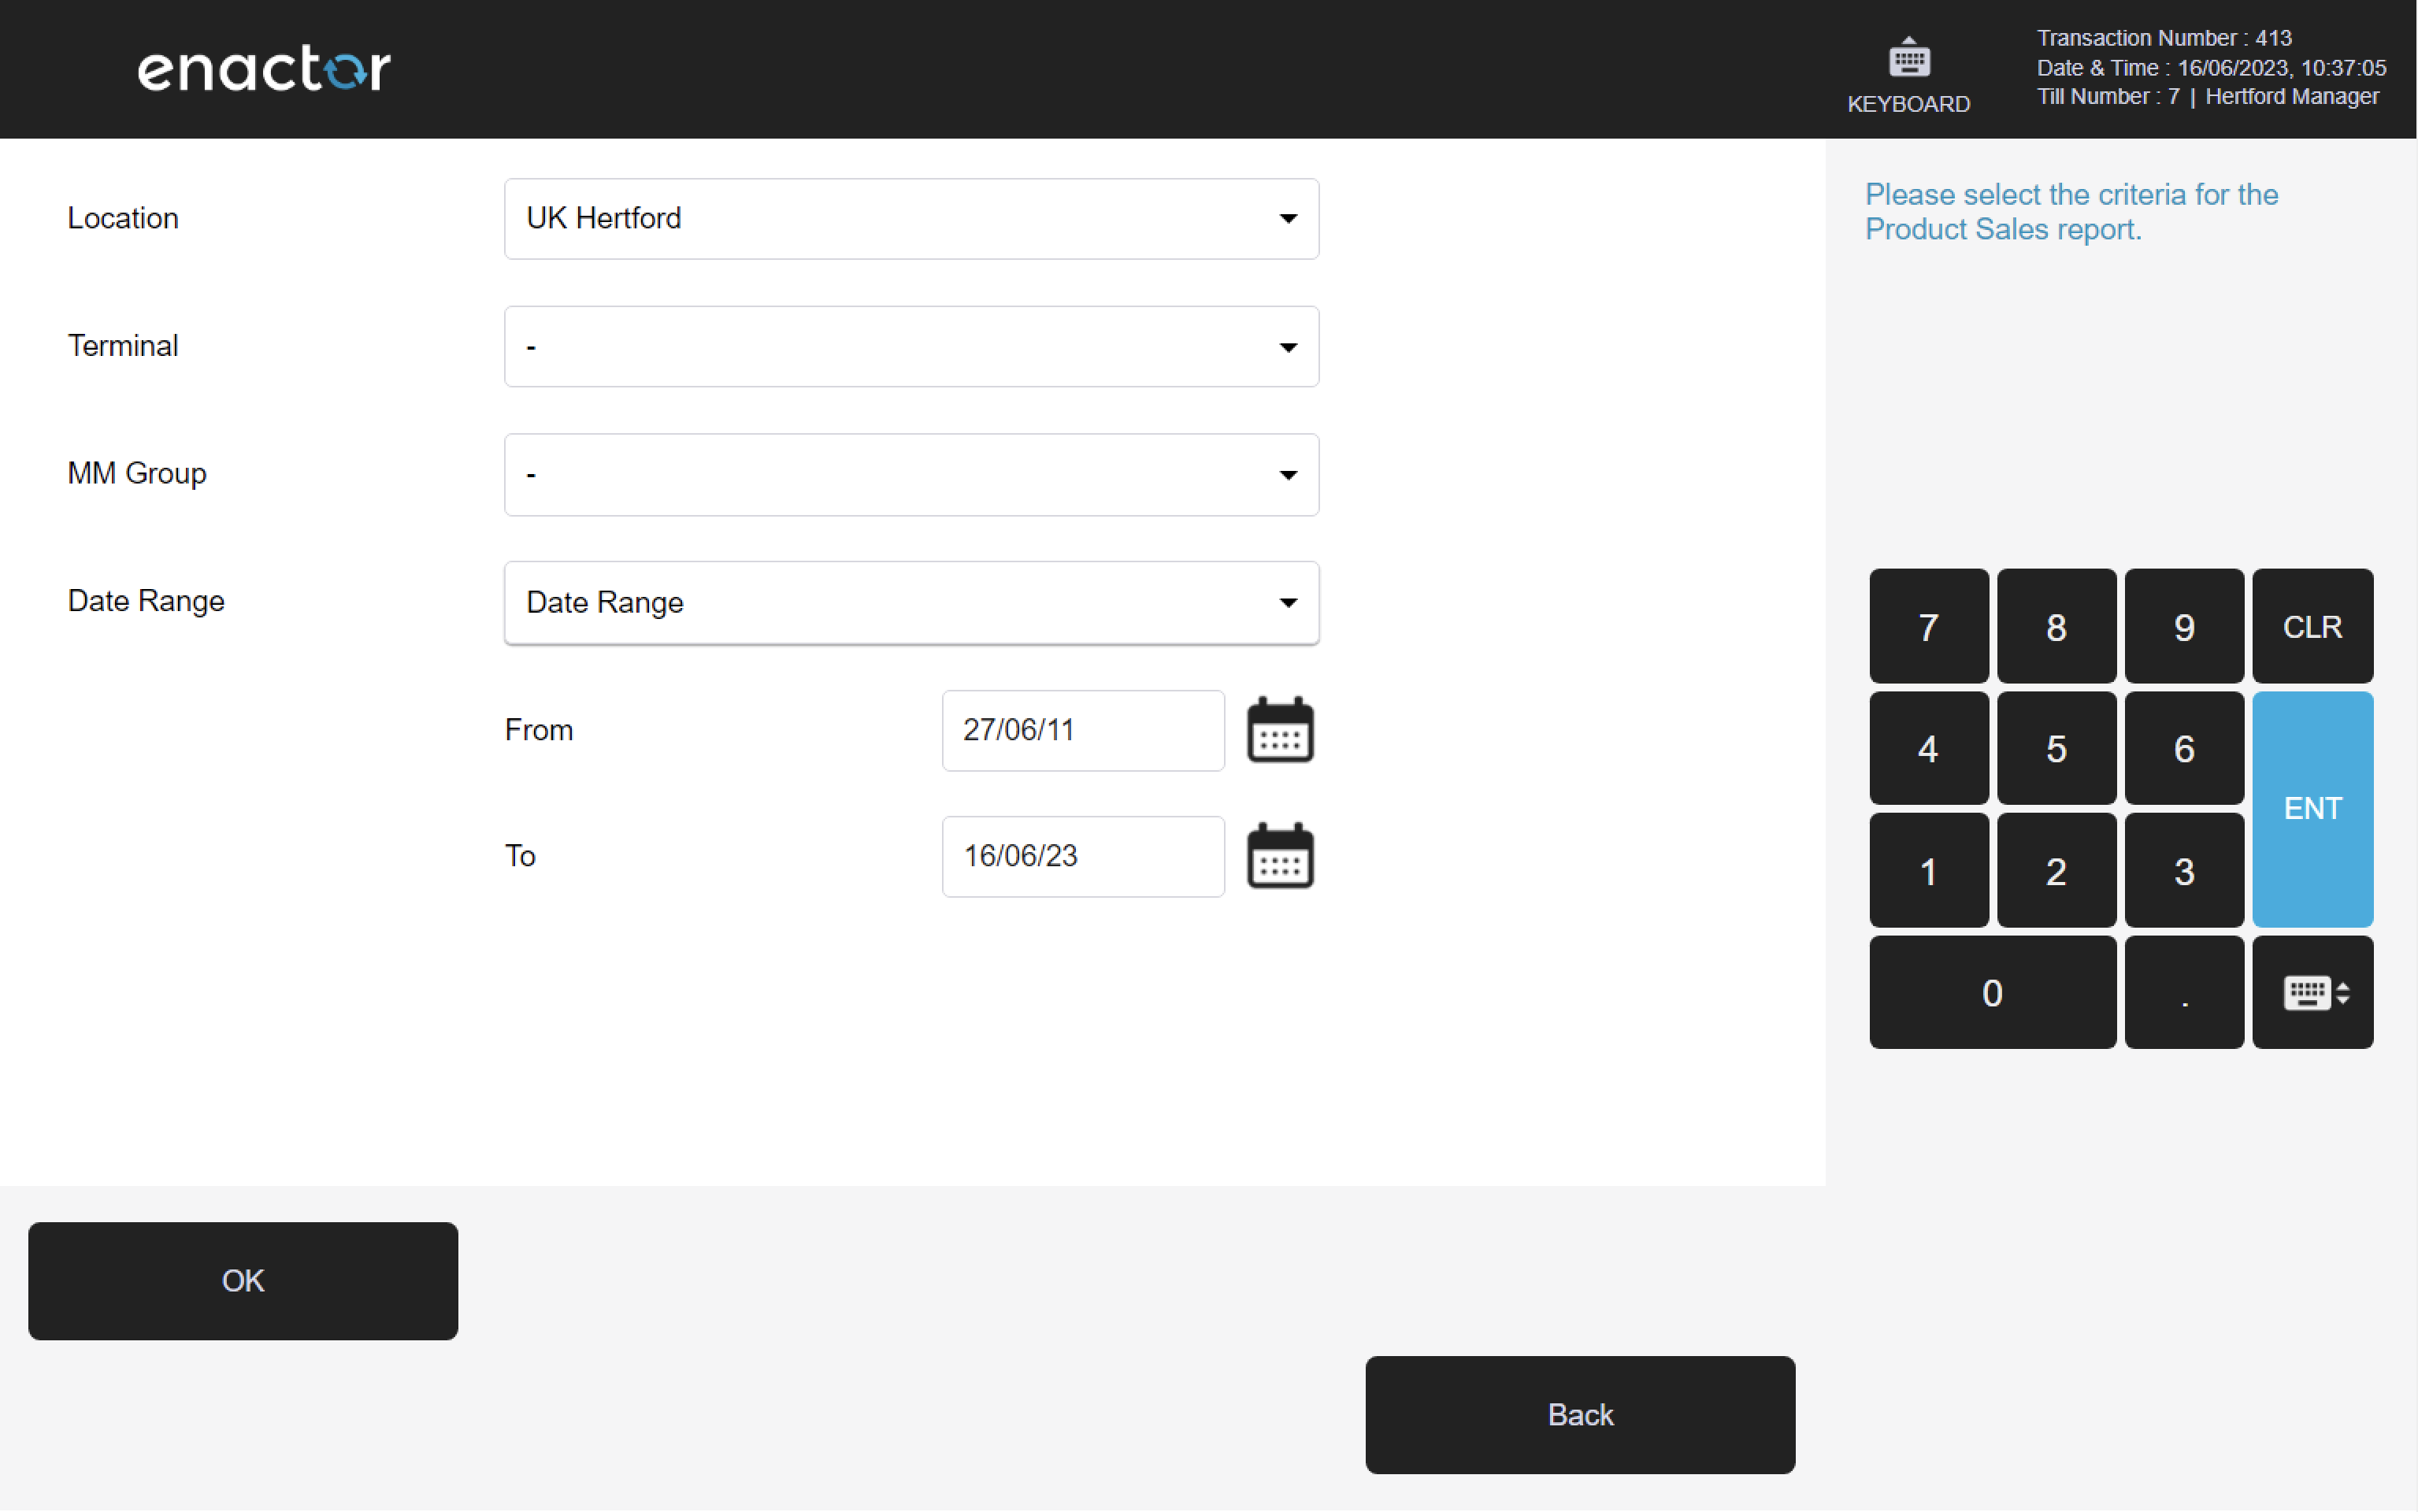
1.3 Product Sales
Path: Product Reports > Product Sales
View product sales information.
Filter Criteria
| Property | Description |
|---|---|
| Location | Dropdown selection of available locations. |
| Terminal | Dropdown selection of terminals, filtered by the selected location. |
| MM Group | Dropdown selection of merchandise management group. |
| Date Range | Date range selector with from/to date inputs. |
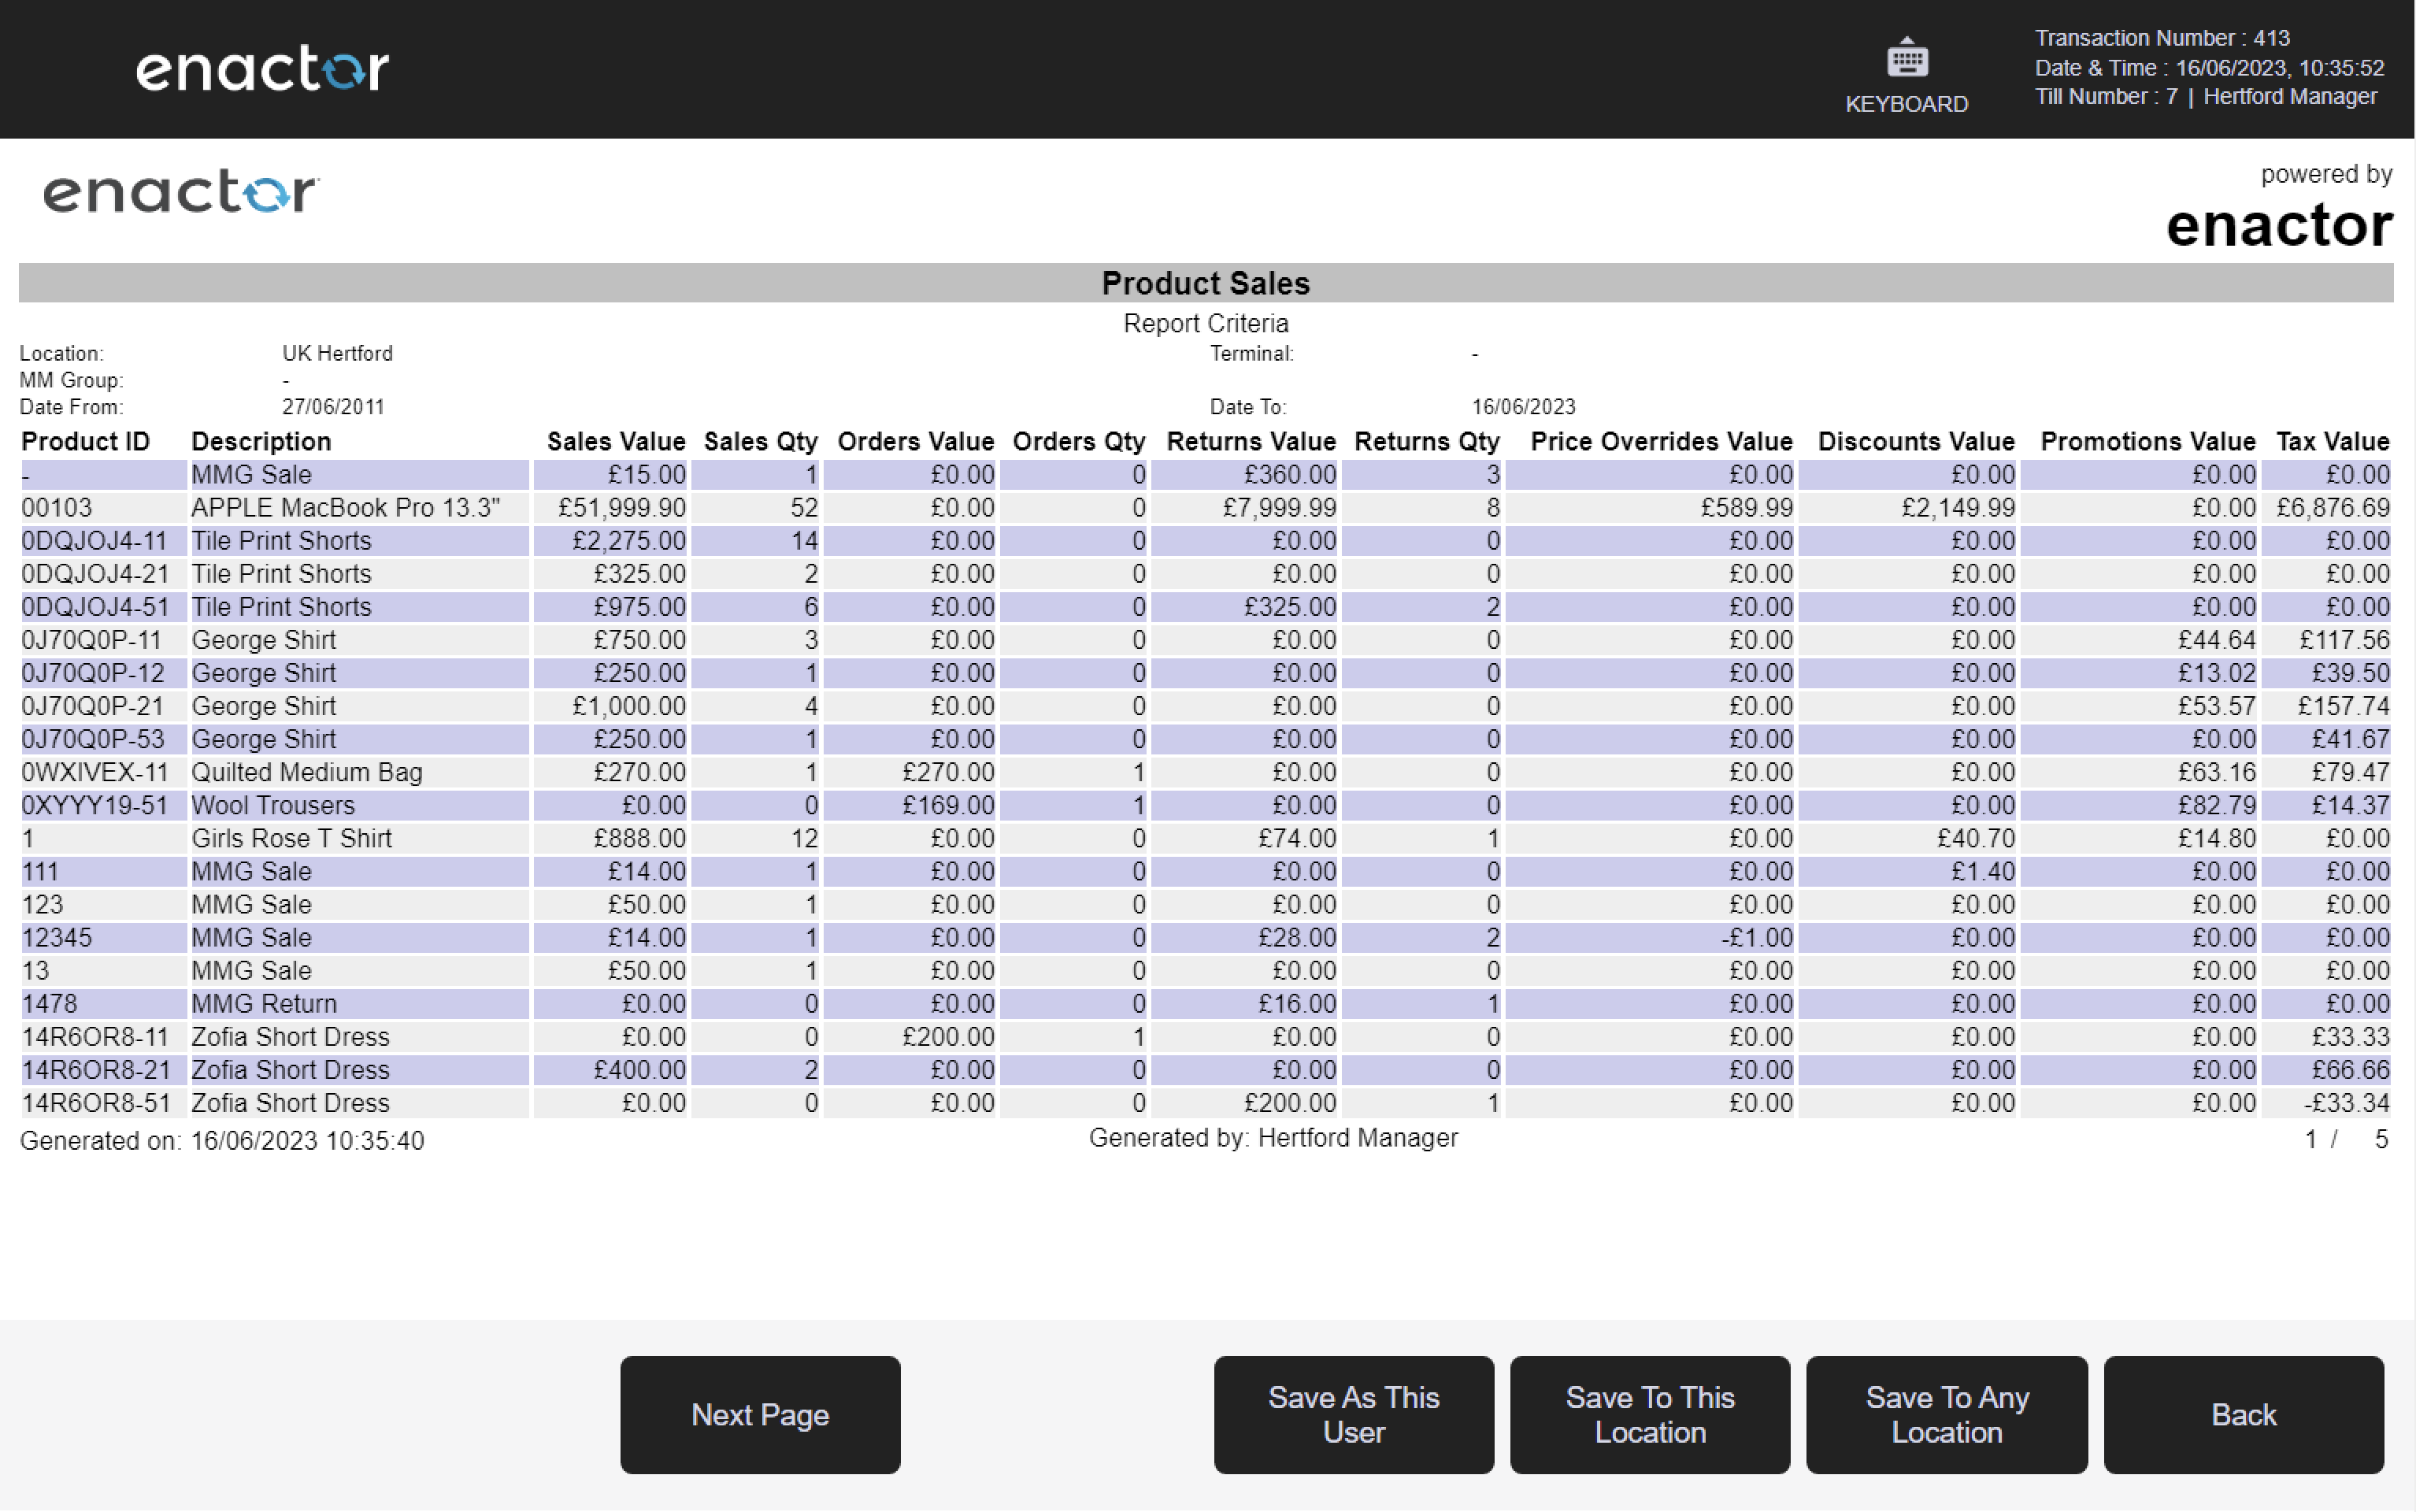
Output Columns
| Property | Description |
|---|---|
| Product ID | The unique identifier of the product. |
| Description | The product description. |
| Sales Value | The total sales value for the product within the selected period. |
| Sales Qty | The total sales quantity for the product within the selected period. |
| Orders Value | The total orders value for the product within the selected period. |
| Orders Qty | The total orders quantity for the product within the selected period. |
| Returns Value | The total returns value for the product within the selected period. |
| Returns Qty | The total returns quantity for the product within the selected period. |
| Price Overrides Value | The total value of price overrides applied to the product. |
| Discounts Value | The total discounts value applied to the product. |
| Promotions Value | The total promotions value applied to the product. |
| Tax Value | The total tax value associated with the product sales. |
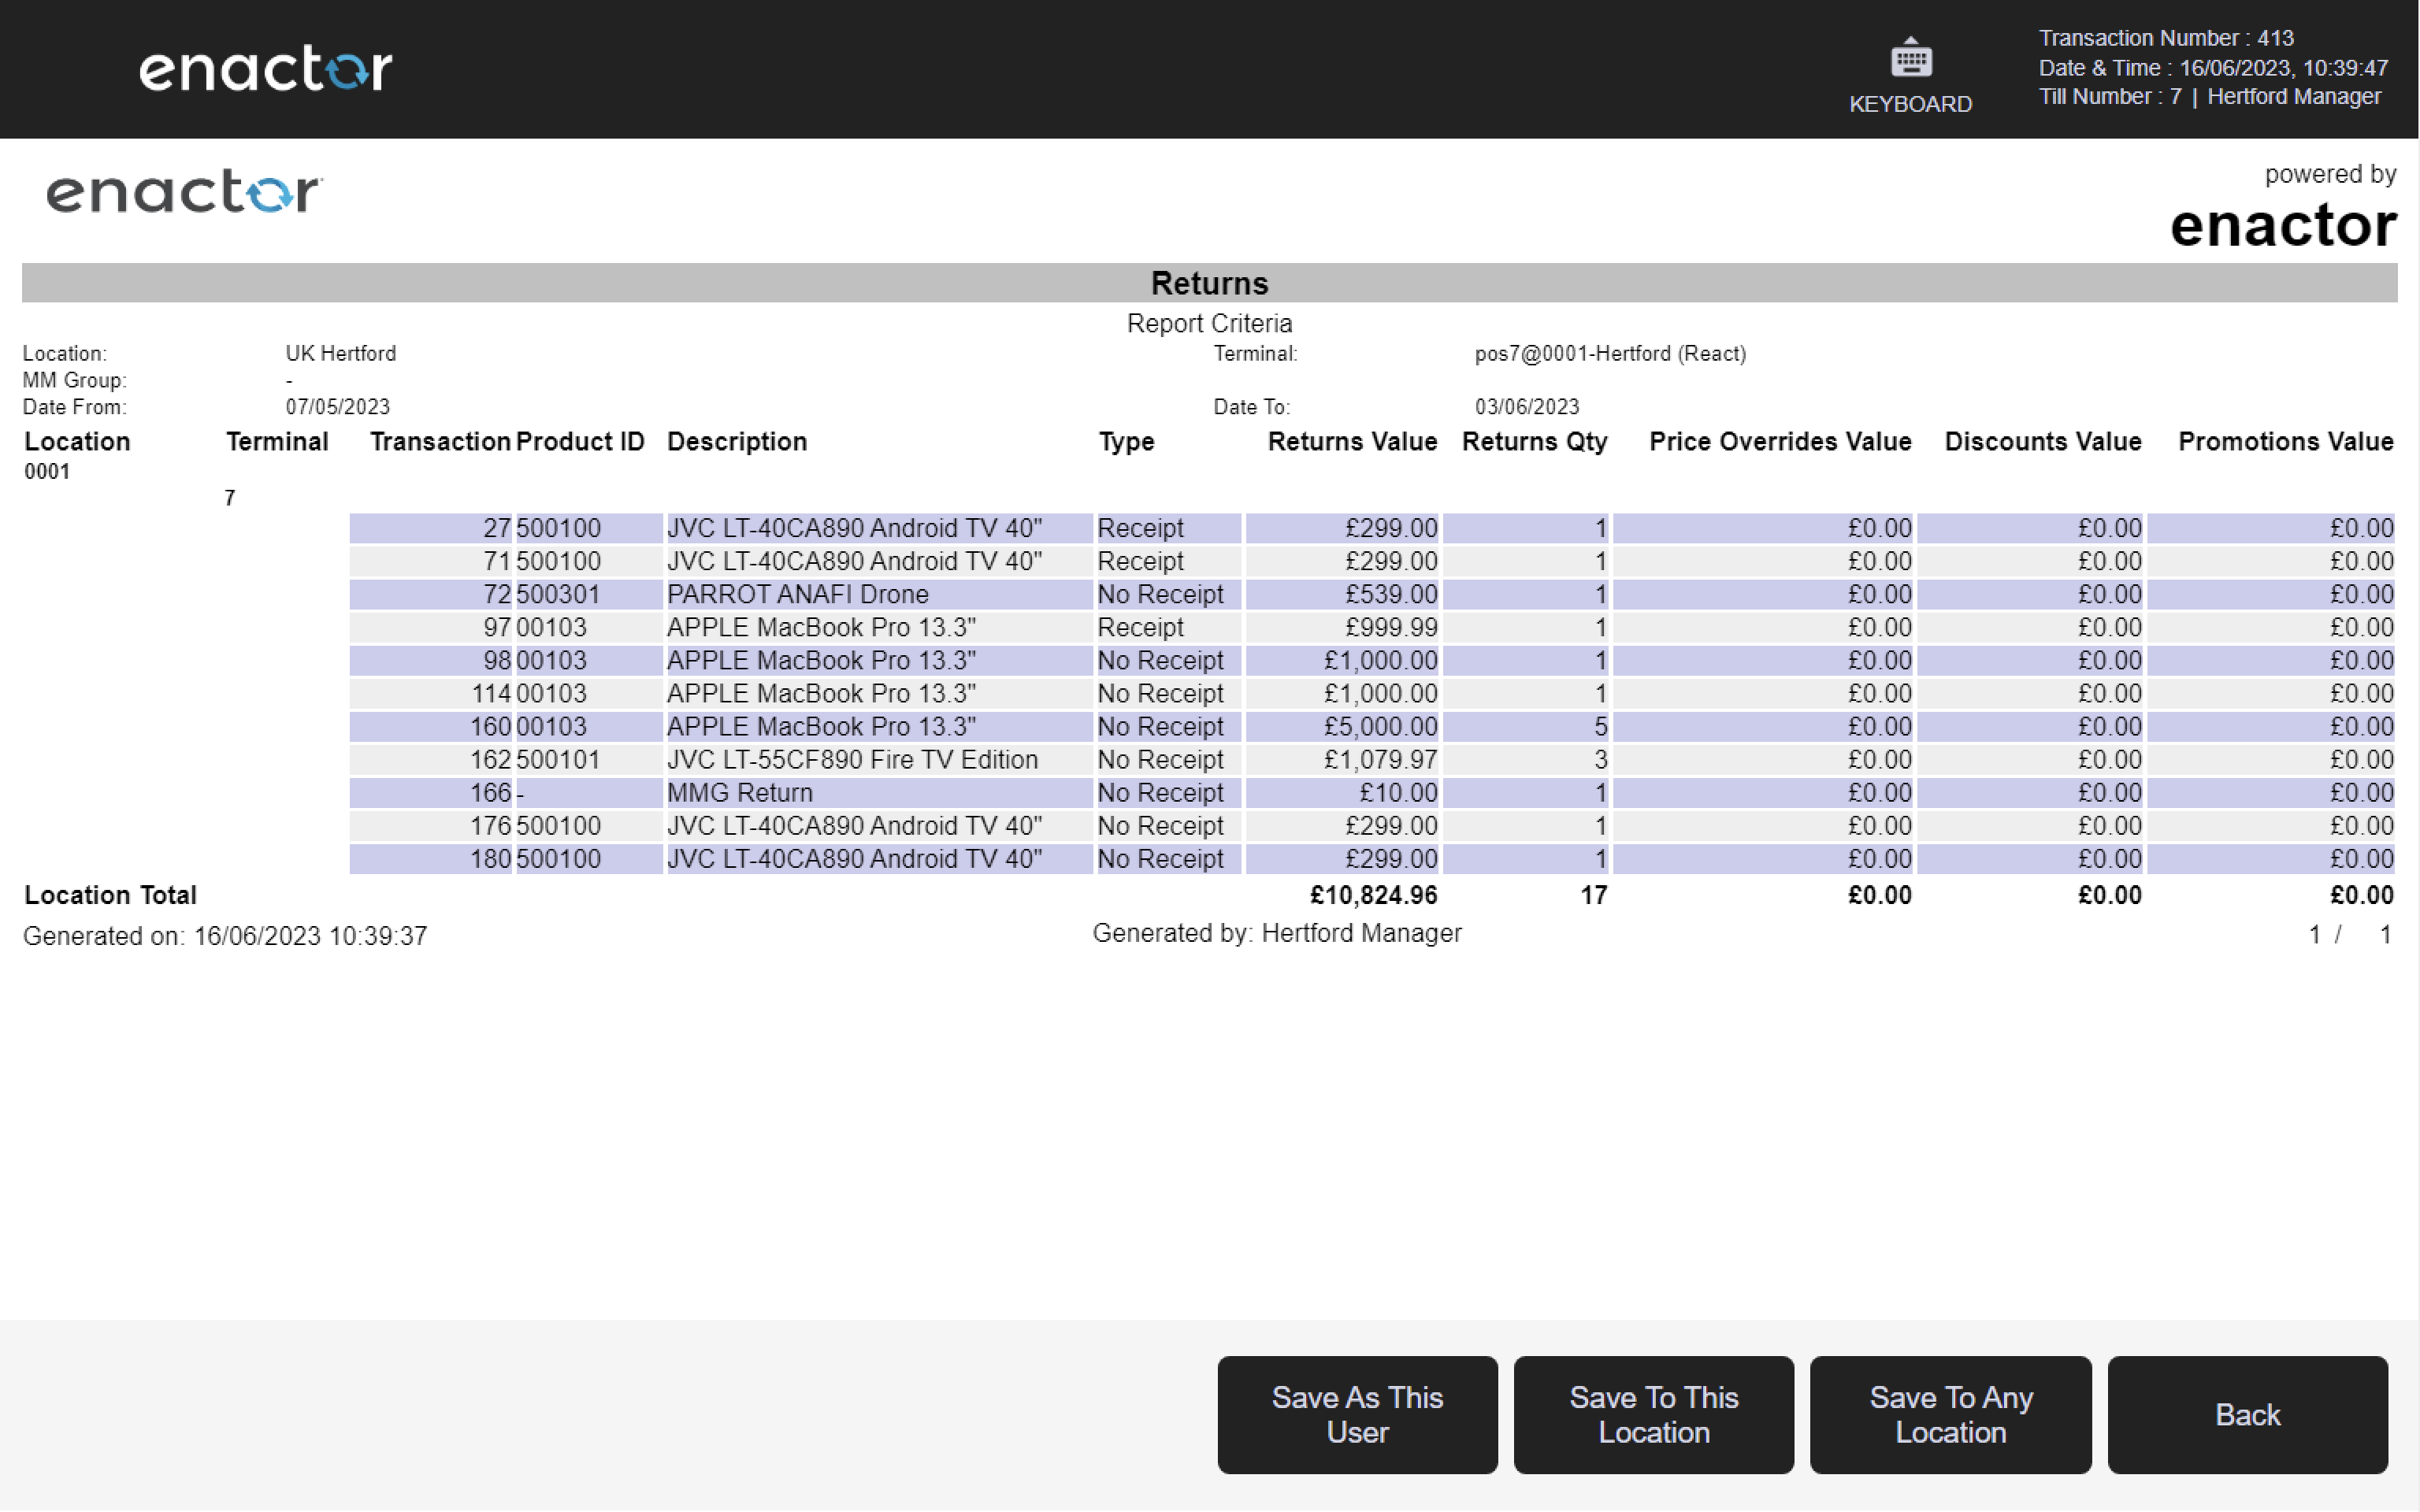
1.4 Returns
Path: Product Reports > Returns
View return information.
Filter Criteria
| Property | Description |
|---|---|
| Location | Dropdown selection of available locations. |
| Terminal | Dropdown selection of terminals, filtered by the selected location. |
| MM Group | Dropdown selection of merchandise management group. |
| Date Range | Date range selector with from/to date inputs. |

Output Columns
| Property | Description |
|---|---|
| Location | The location at which the return was processed. |
| Terminal | The terminal at which the return was processed. |
| Transaction | The transaction identifier for the return. |
| Product ID | The unique identifier of the returned product. |
| Description | The product description. |
| Type | The type of return transaction. |
| Returns Value | The value of the returned item. Grand totals are shown at the bottom. |
| Returns Qty | The quantity of the returned item. Grand totals are shown at the bottom. |
| Price Overrides Value | The value of any price overrides applied. Grand totals are shown at the bottom. |
| Discounts Value | The value of any discounts applied. Grand totals are shown at the bottom. |
| Promotions Value | The value of any promotions applied. Grand totals are shown at the bottom. |
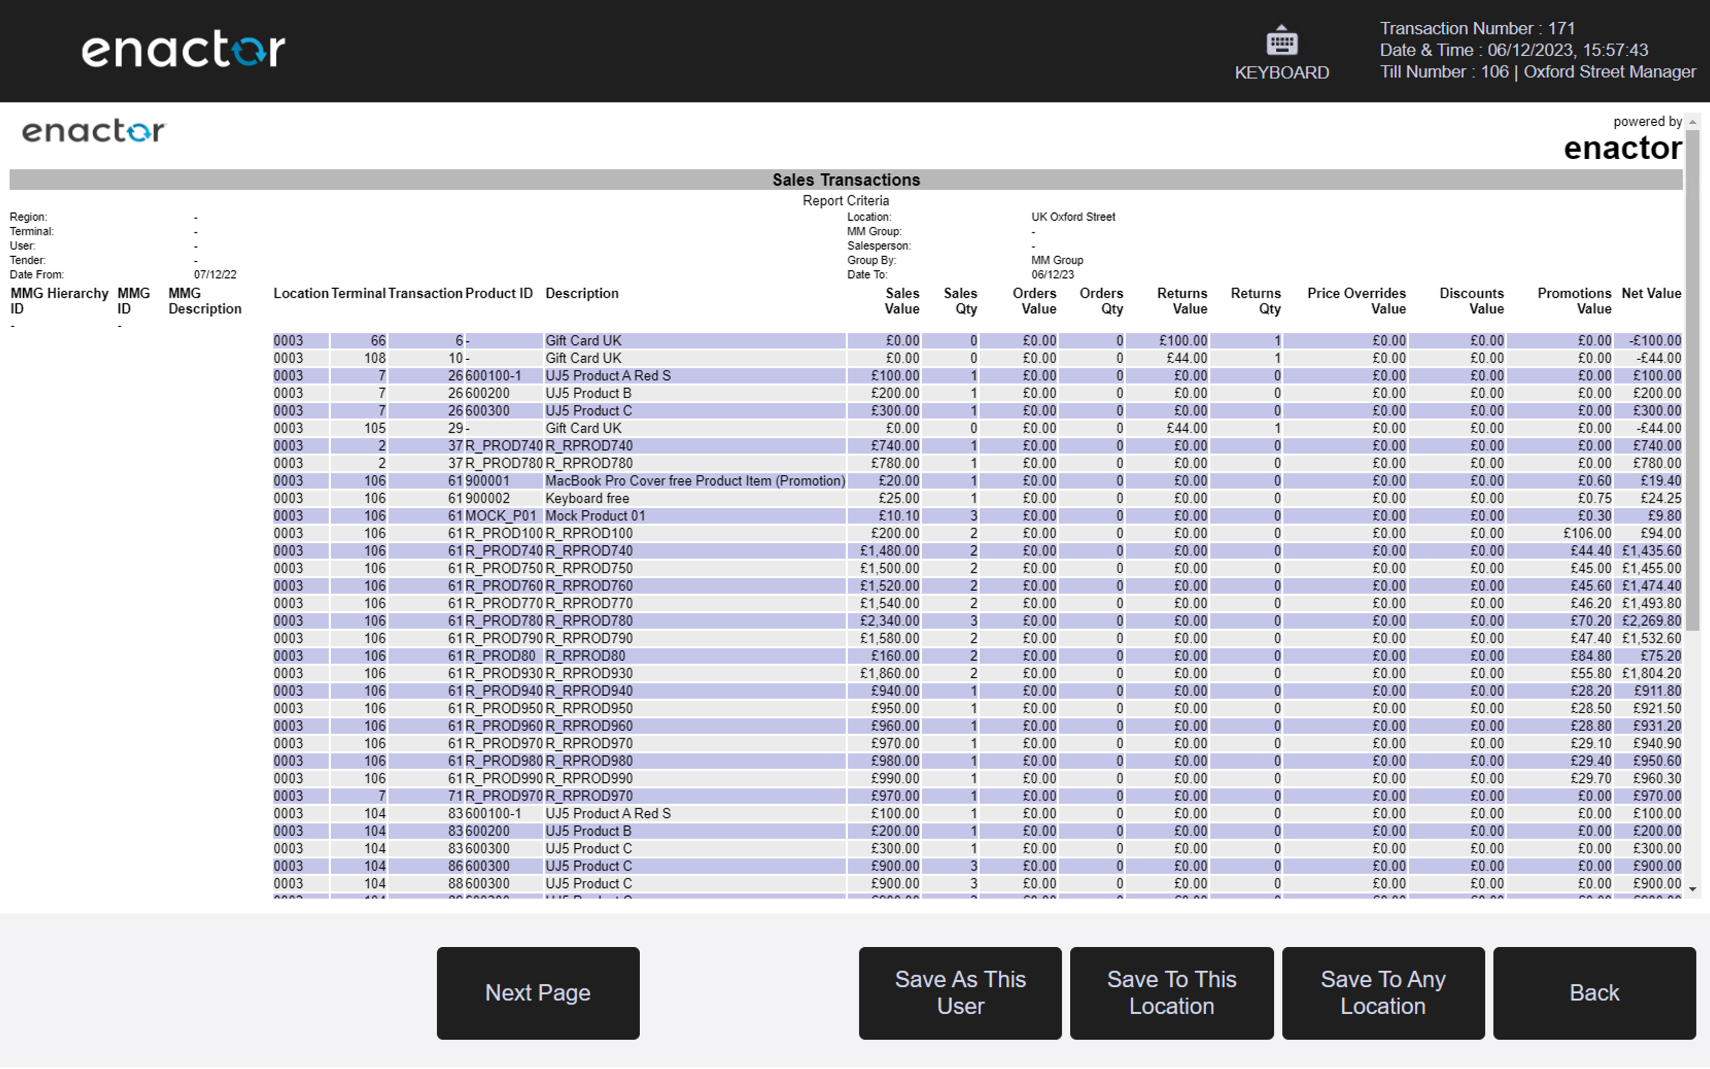
1.5 Sales Transactions
Path: Product Reports > Sales Transactions
View sales transaction information.
Filter Criteria
| Property | Description |
|---|---|
| Region | Dropdown selection of available regions. |
| Location | Dropdown selection of locations, filtered by the selected region. |
| Terminal | Dropdown selection of terminals, filtered by the selected location. |
| MM Group | Dropdown selection of merchandise management group. |
| User | Dropdown selection of user. |
| Salesperson | Dropdown selection of salesperson. |
| Tender | Dropdown selection of tender type. |
| Group By | Dropdown to group results by MM Group, Location, or Transaction. |
| Date Range | Date range selector with from/to date inputs. |

Output Columns
| Property | Description |
|---|---|
| MMG Hierarchy ID | The full hierarchy identifier of the merchandise management group. |
| MMG ID | The merchandise management group identifier. |
| MMG Description | The description of the merchandise management group. |
| Location | The location of the transaction. |
| Terminal | The terminal on which the transaction was processed. |
| Transaction | The transaction identifier. |
| Product ID | The unique identifier of the product. |
| Description | The product description. |
| Sales Value | The total sales value within the selected period. |
| Sales Qty | The total sales quantity within the selected period. |
| Orders Value | The total orders value within the selected period. |
| Orders Qty | The total orders quantity within the selected period. |
| Returns Value | The total returns value within the selected period. |
| Returns Qty | The total returns quantity within the selected period. |
| Price Overrides Value | The total value of price overrides applied. |
| Discounts Value | The total discounts value applied. |
| Promotions Value | The total promotions value applied. |
| Net Value | The net value per MM group (grand total per group shown). |
1.6 Trading Summary
Path: Product Reports > Trading Summary
View trading summary information. The results table presents a column for each day of the selected date range.
Filter Criteria
| Property | Description |
|---|---|
| Location | Dropdown selection of available locations. |
| Date Range | Date range selector with from/to date inputs. |
Output Columns
The Trading Summary report presents rows grouped into the following sections, with a column for each day of the week across the selected period:
| Section / Row | Description |
|---|---|
| Merchandise | |
| Sales | Total merchandise sales value per day. |
| Returns | Total merchandise returns value per day. |
| Net Sales | Net merchandise sales (sales minus returns) per day. |
| Discounts | Total merchandise discounts per day. |
| Promotions | Total merchandise promotions per day. |
| Total Merchandise | Combined merchandise total per day. |
| Non Merchandise | |
| Sales | Total non-merchandise sales value per day. |
| Returns | Total non-merchandise returns value per day. |
| Net | Net non-merchandise value per day. |
| Discounts | Total non-merchandise discounts per day. |
| Total | Combined non-merchandise total per day. |
| Account Movements | |
| Customer Account Payments | Total customer account payments per day. |
| Customer Account Withdrawals | Total customer account withdrawals per day. |
| All Sales | Combined totals of all merchandise and non-merchandise per day. |
| Terminal Cash Management | |
| Incomes | Total terminal income transactions per day. |
| Expenses | Total terminal expense transactions per day. |
| Net | Net terminal cash management value per day. |
| Total Trading | Total trading value per day. |
| Customer Count | Total number of customer transactions per day. |
| Terminal Declaration | |
| Opening Floats | Opening float value per day. |
| Extra Floats | Extra float value added during the day. |
| Pickups | Total pickup value per day. |
| Closing Float | Closing float value per day. |
| Total Receipts | Total receipts per day. |
| Total Trading | Total terminal trading per day. |
| Overs and Unders | Discrepancy between declared and expected values per day. |
| Safe Cash Management | |
| Incomes | Total safe income transactions per day. |
| Expenses | Total safe expense transactions per day. |
| Adjustments | Total safe adjustment transactions per day. |
| Currency Purchases | Total currency purchase value per day. |
| Safe Declaration | |
| Opening Balance | Safe opening balance per day. |
| Banking | Total banking value per day. |
| Closing Balance | Safe closing balance per day. |
| Total Accounted For | Total value accounted for in the safe per day. |
| Closing Store Floats | |
| Cash in Safe | Total cash held in the safe at close per day. |
| Other Tenders in Safe | Total non-cash tenders held in the safe at close per day. |
| Cash in Drawers | Total cash held in till drawers at close per day. |
| Other Tenders in Drawers | Total non-cash tenders held in drawers at close per day. |
| Total Monies | Total monies at close per day. |
| Weekly Total | Accumulated weekly total column. |
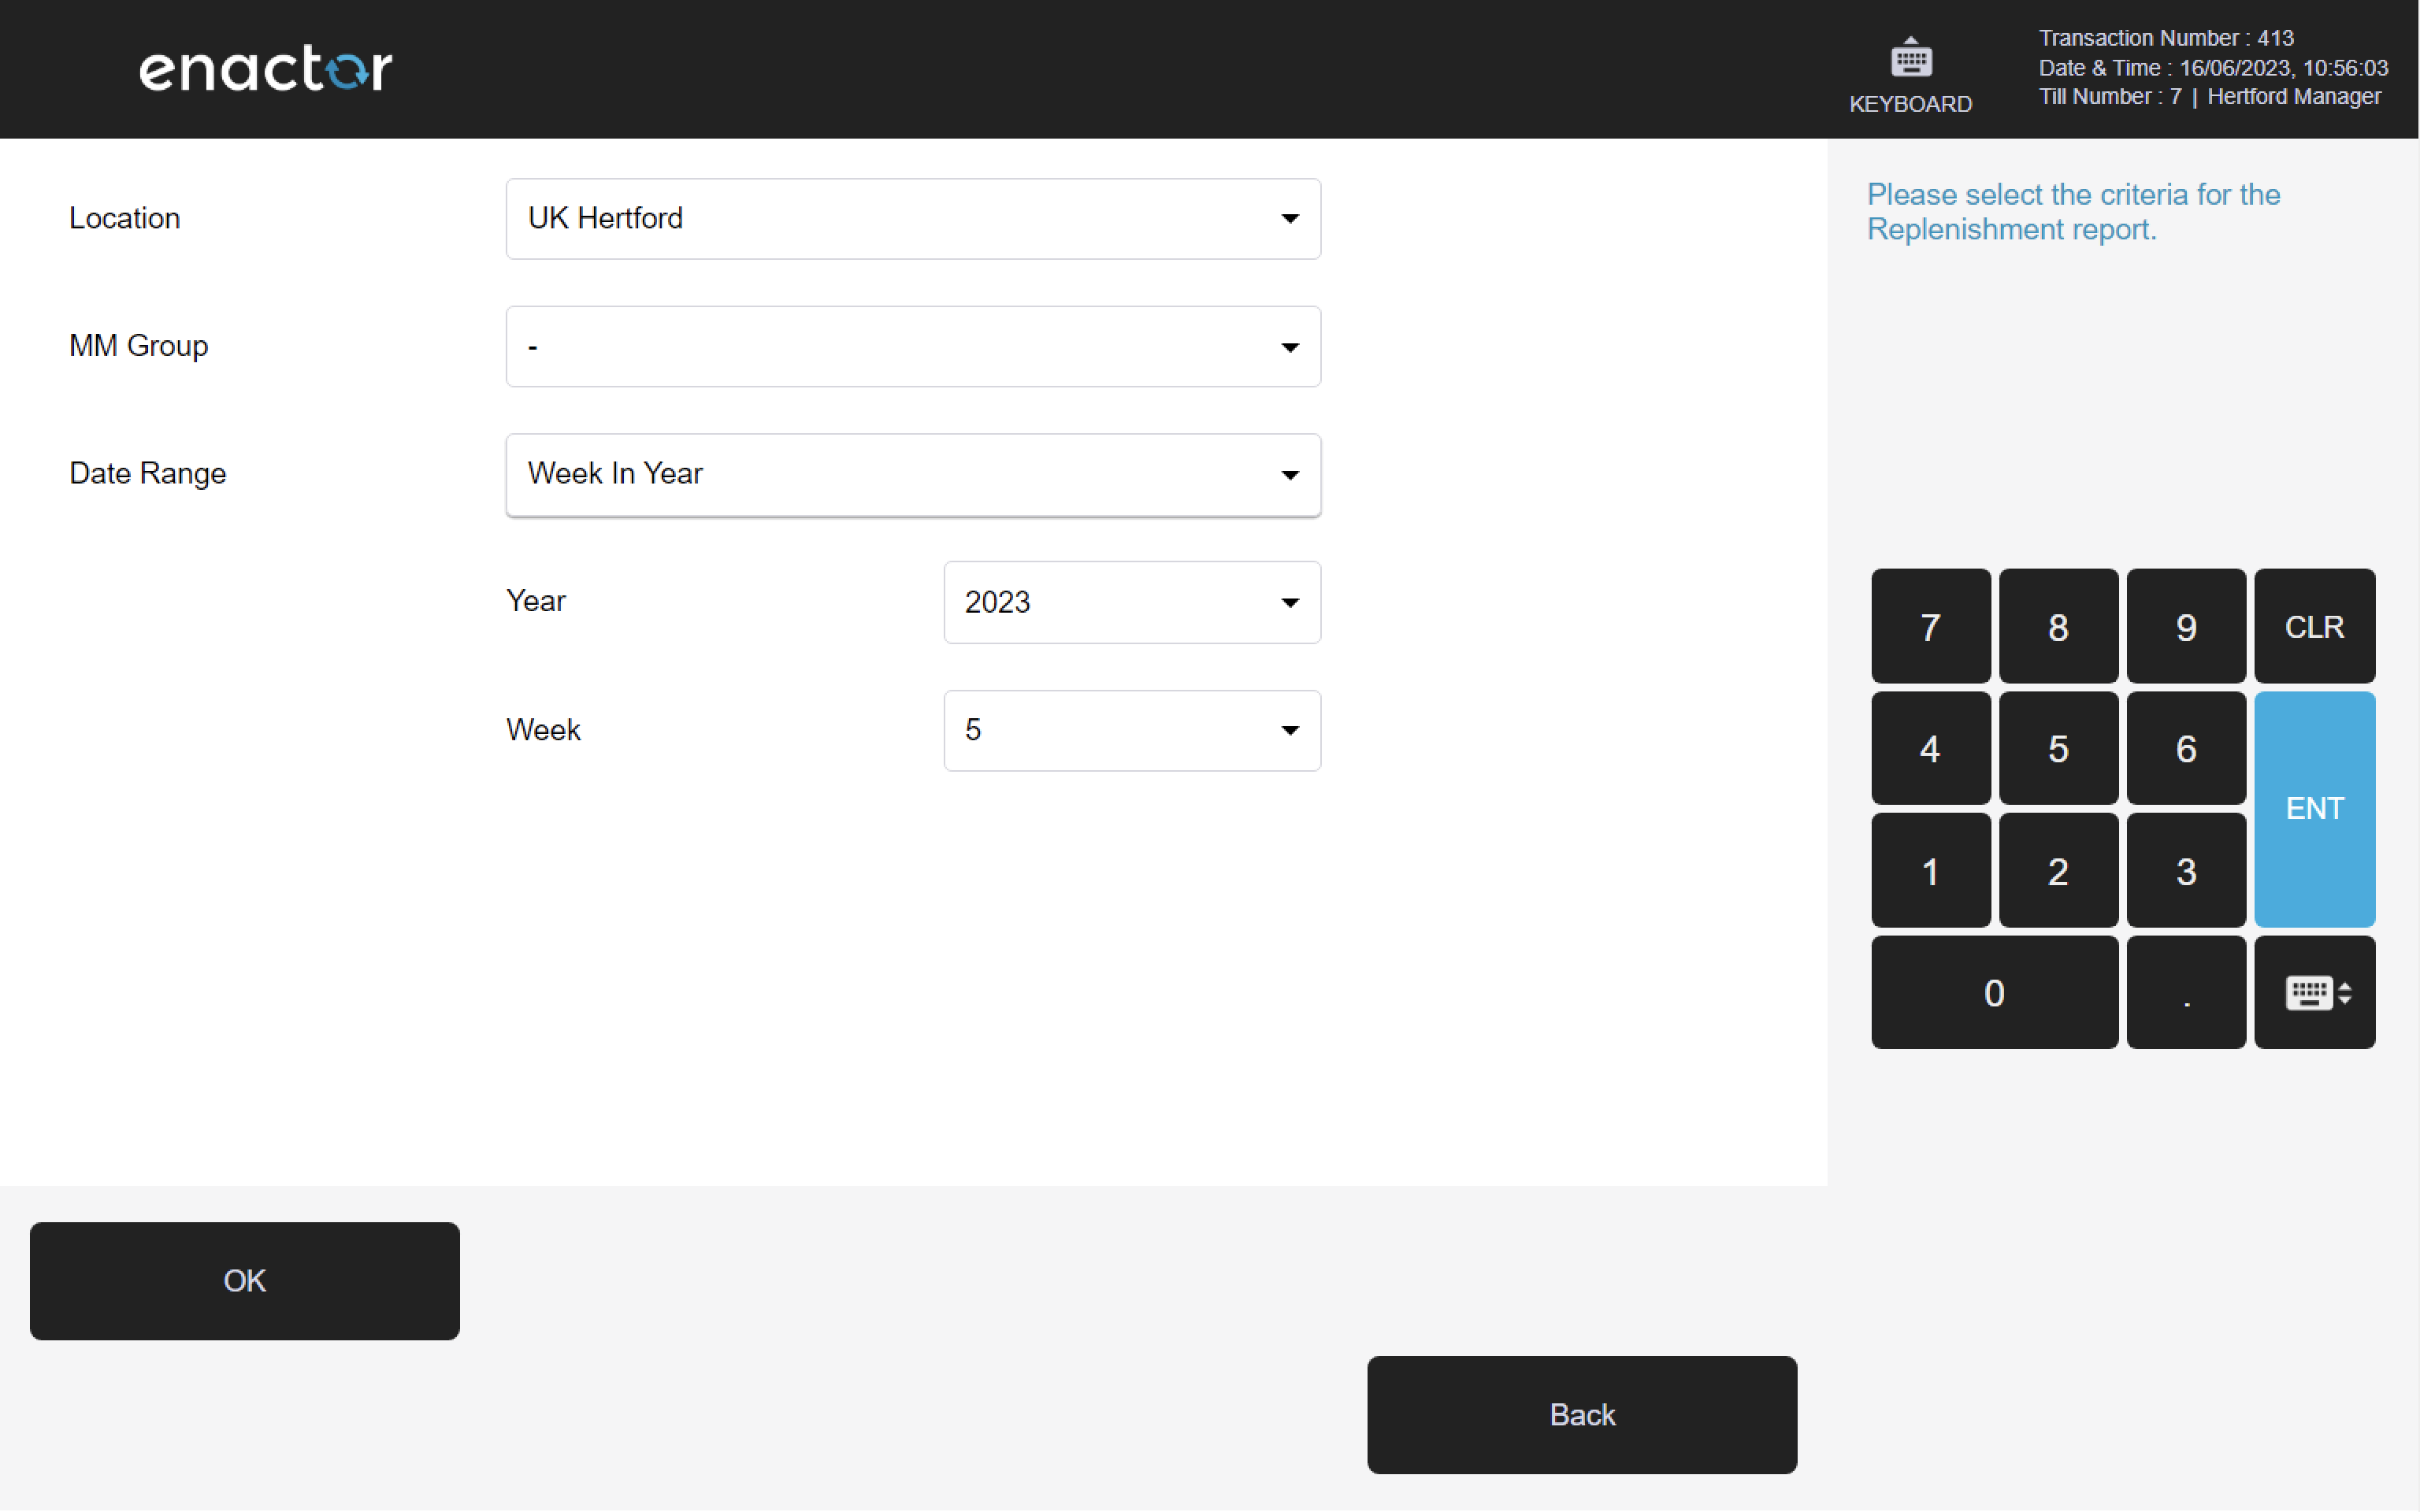
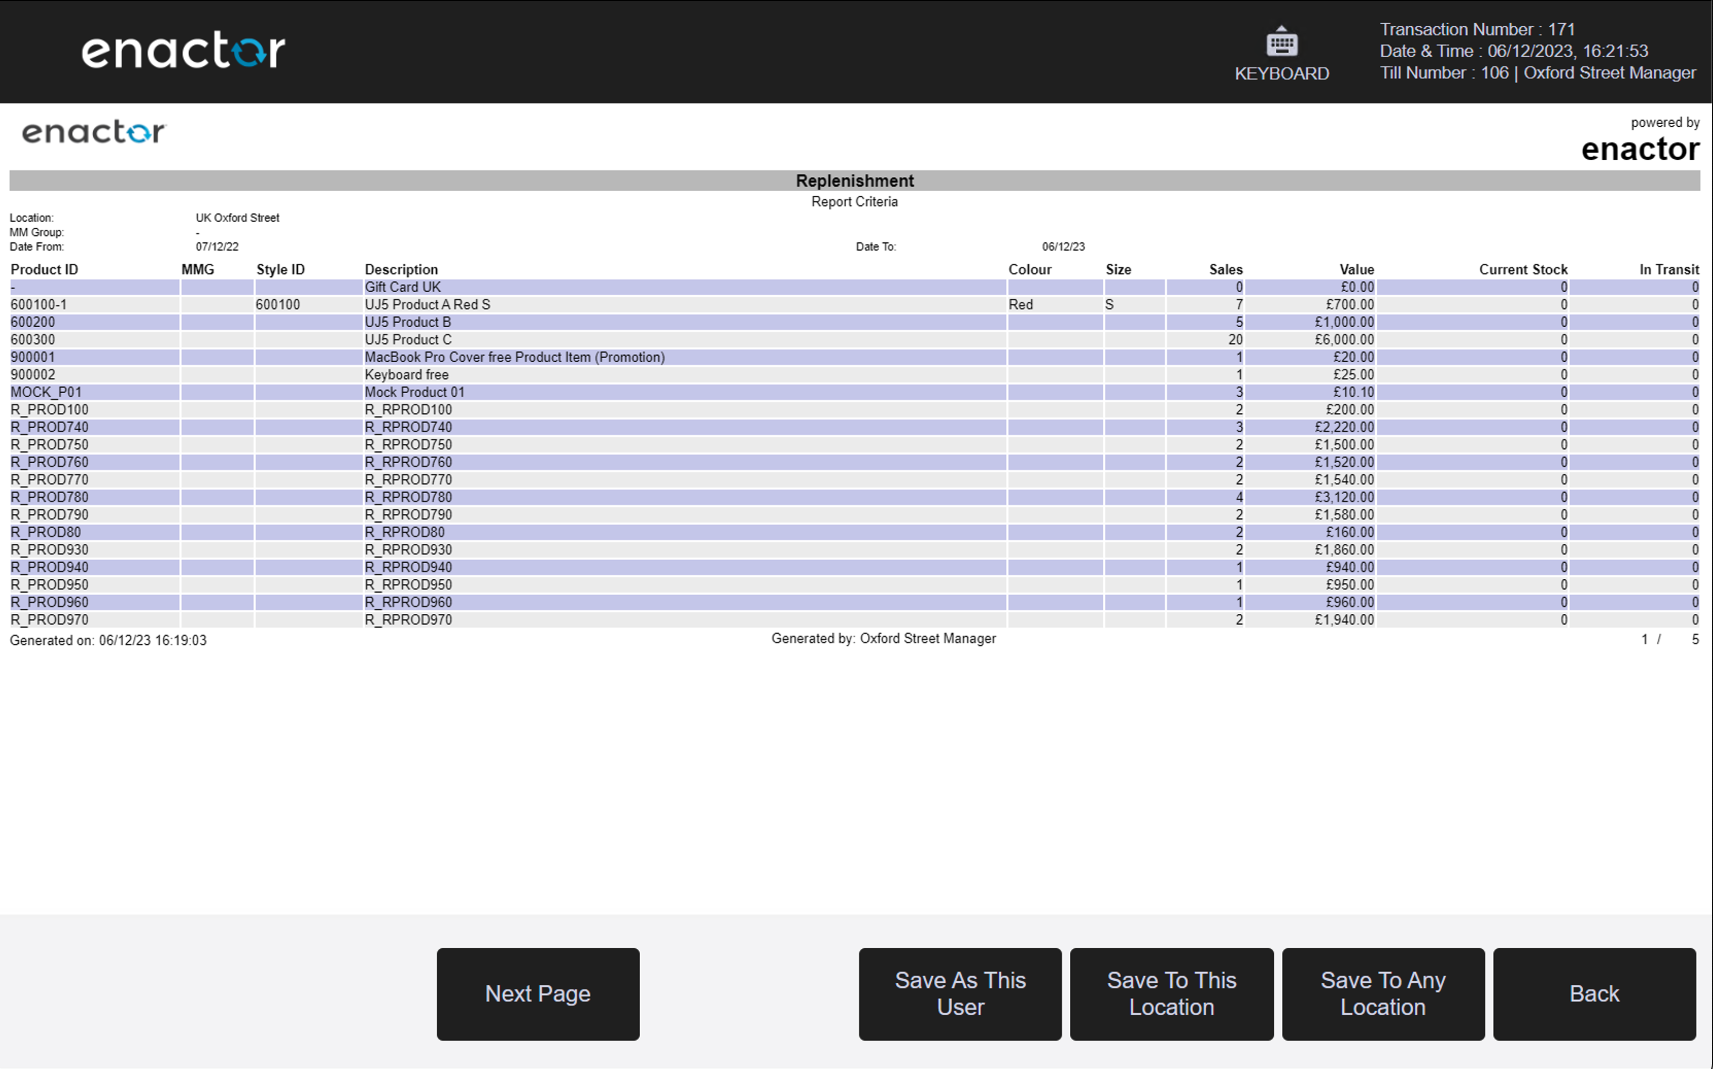
1.7 Replenishment Report
Path: Product Reports > Replenishment Report

1.7.1 Replenishment
Path: Replenishment Report > Replenishment
View replenishment information.
Filter Criteria
| Property | Description |
|---|---|
| Location | Dropdown selection of available locations. |
| MM Group | Dropdown selection of merchandise management group. |
| Date Range | Date range selector with from/to date inputs. |
Output Columns
| Property | Description |
|---|---|
| Product ID | The unique identifier of the product. |
| MMG | The merchandise management group associated with the product. |
| Style ID | The style identifier associated with the product. |
| Description | The product description. |
| Colour | The colour variant of the product. |
| Size | The size variant of the product. |
| Sales | The total sales quantity within the selected period. |
| Value | The total sales value within the selected period. |
| Current Stock Level | The current stock level held at the location. |
| In Transit | The quantity of the product currently in transit to the location. |
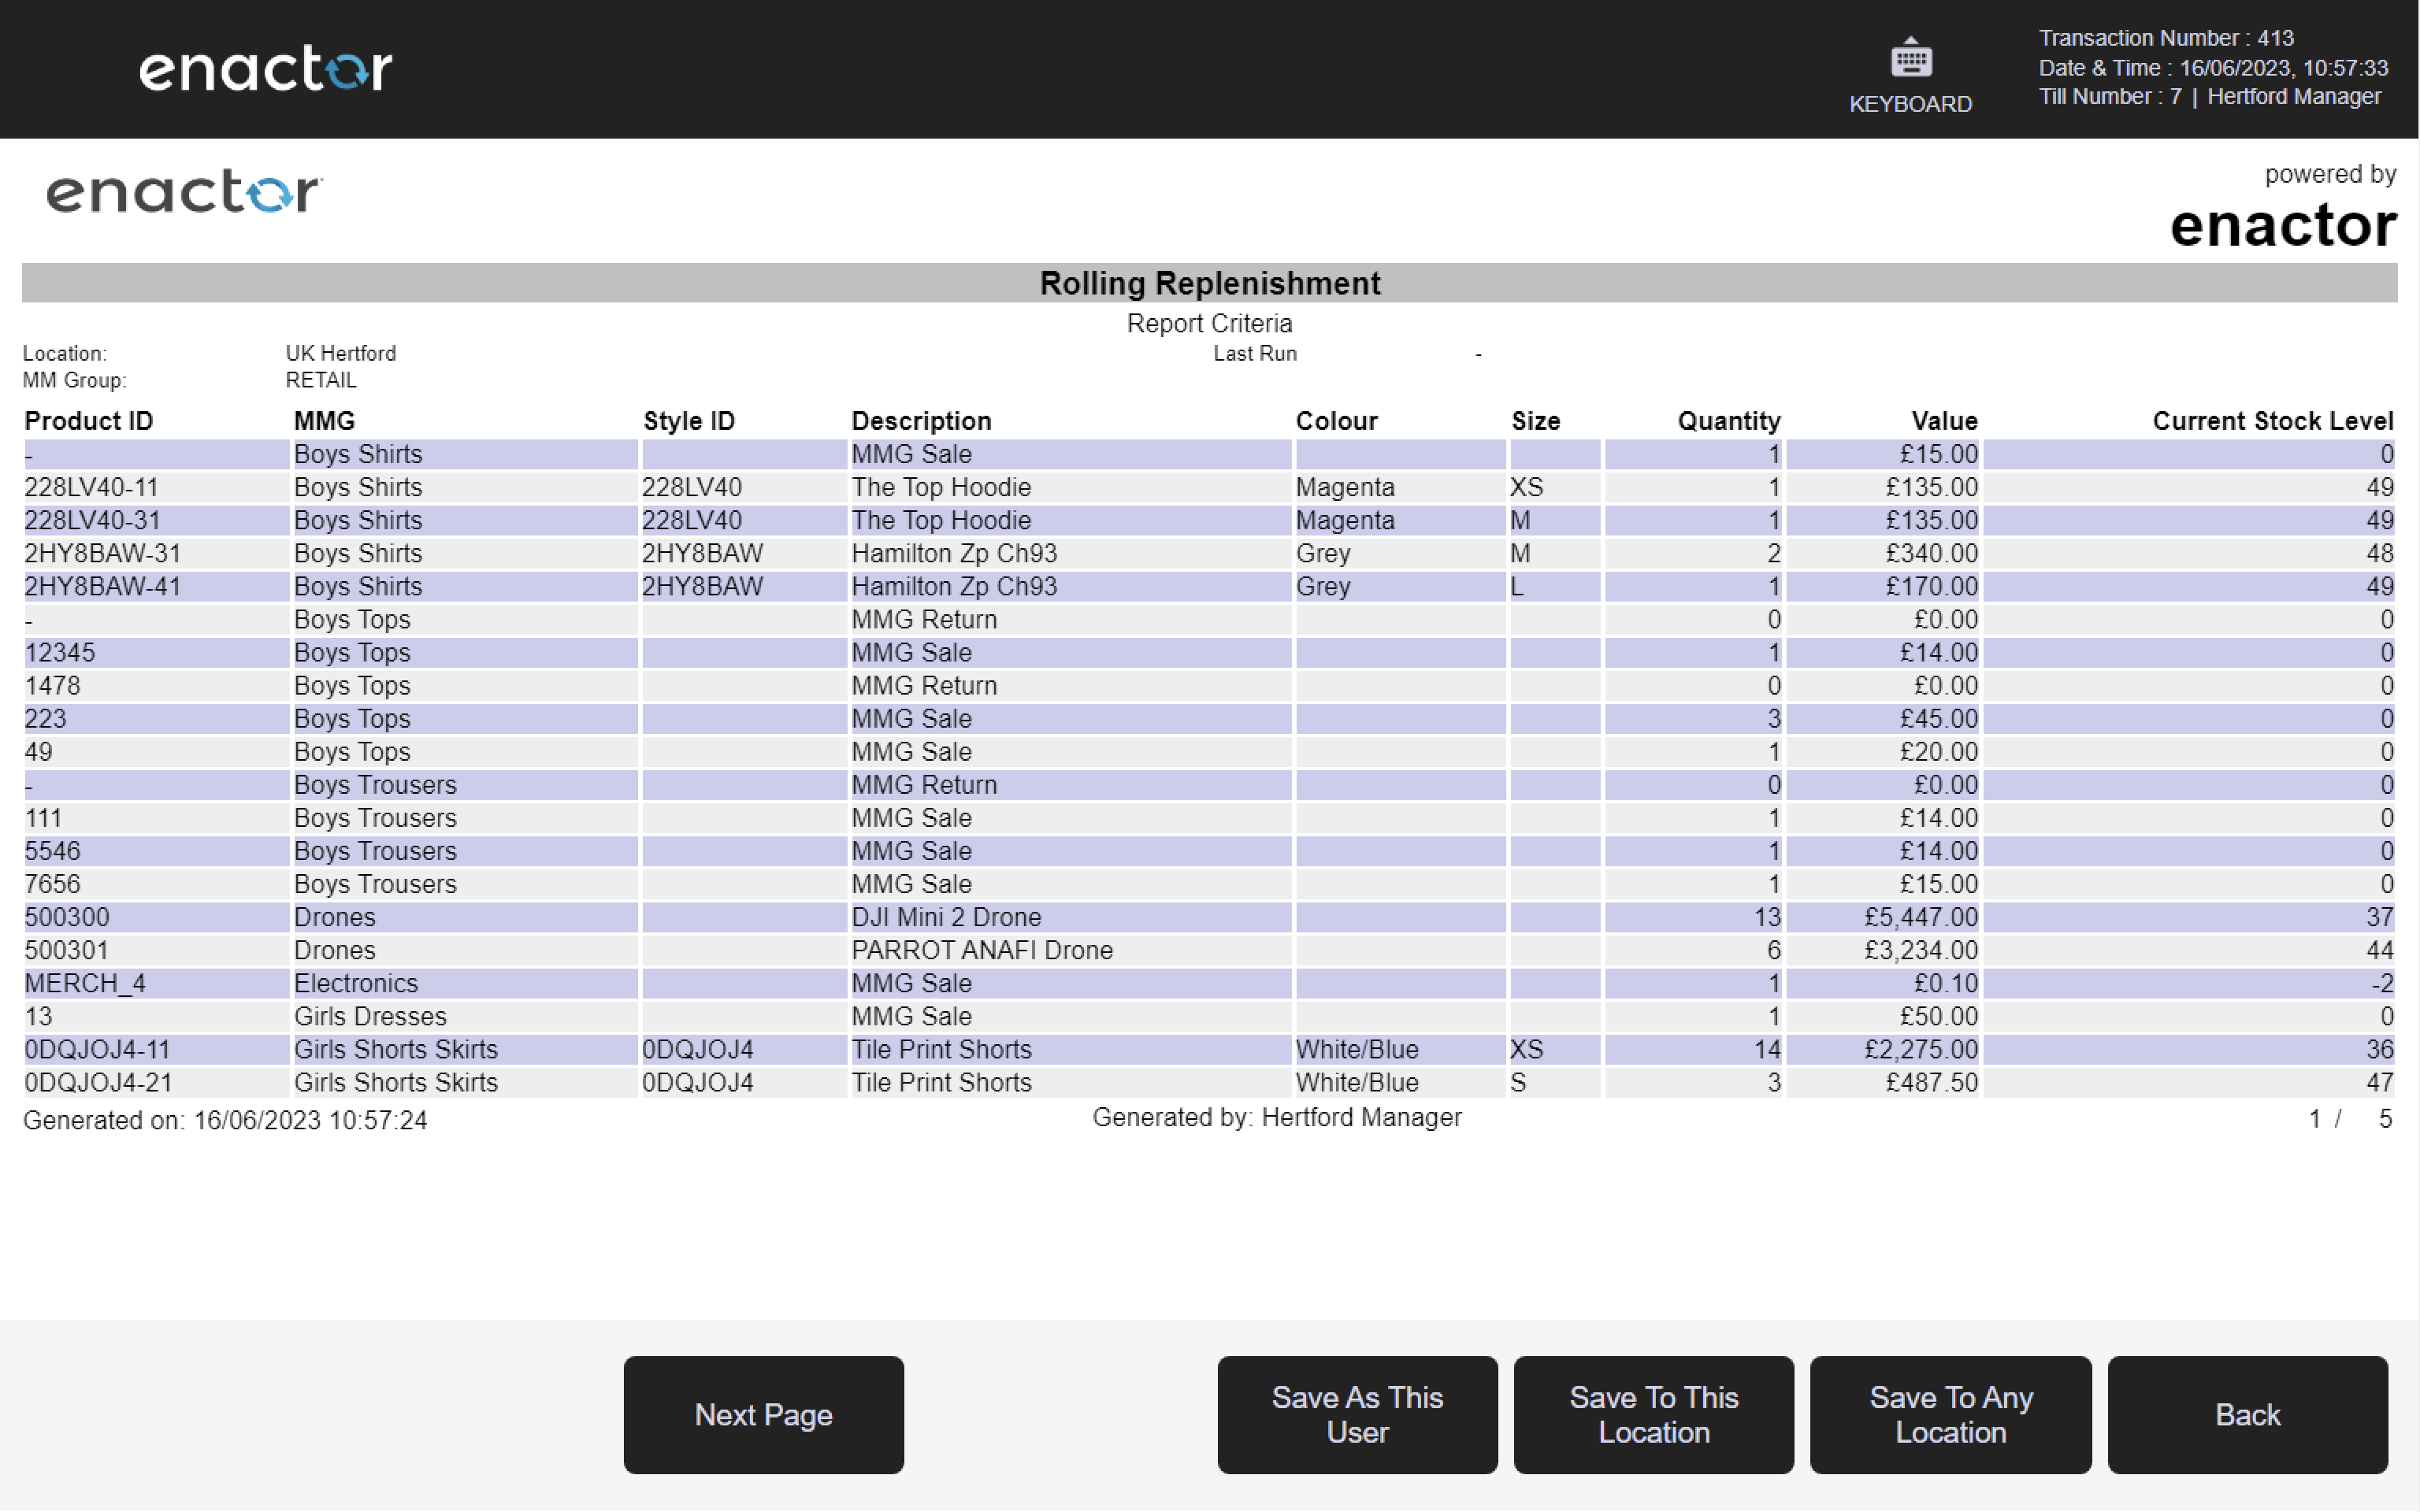
1.7.2 Rolling Replenishment
Path: Replenishment Report > Rolling Replenishment
View rolling replenishment information. The Next button creates a Scheduled Job to run the report.
Filter Criteria
| Property | Description |
|---|---|
| Location | Dropdown selection of available locations. |
| MM Group | Dropdown selection of merchandise management group. |

Output Columns
| Property | Description |
|---|---|
| Product ID | The unique identifier of the product. |
| MMG | The merchandise management group associated with the product. |
| Style ID | The style identifier associated with the product. |
| Description | The product description. |
| Colour | The colour variant of the product. |
| Size | The size variant of the product. |
| Quantity | The recommended replenishment quantity. |
| Value | The total value of the recommended replenishment. |
| Current Stock Level | The current stock level held at the location. |
2 Sales Reports
Path: Web Reports > Sales Reports
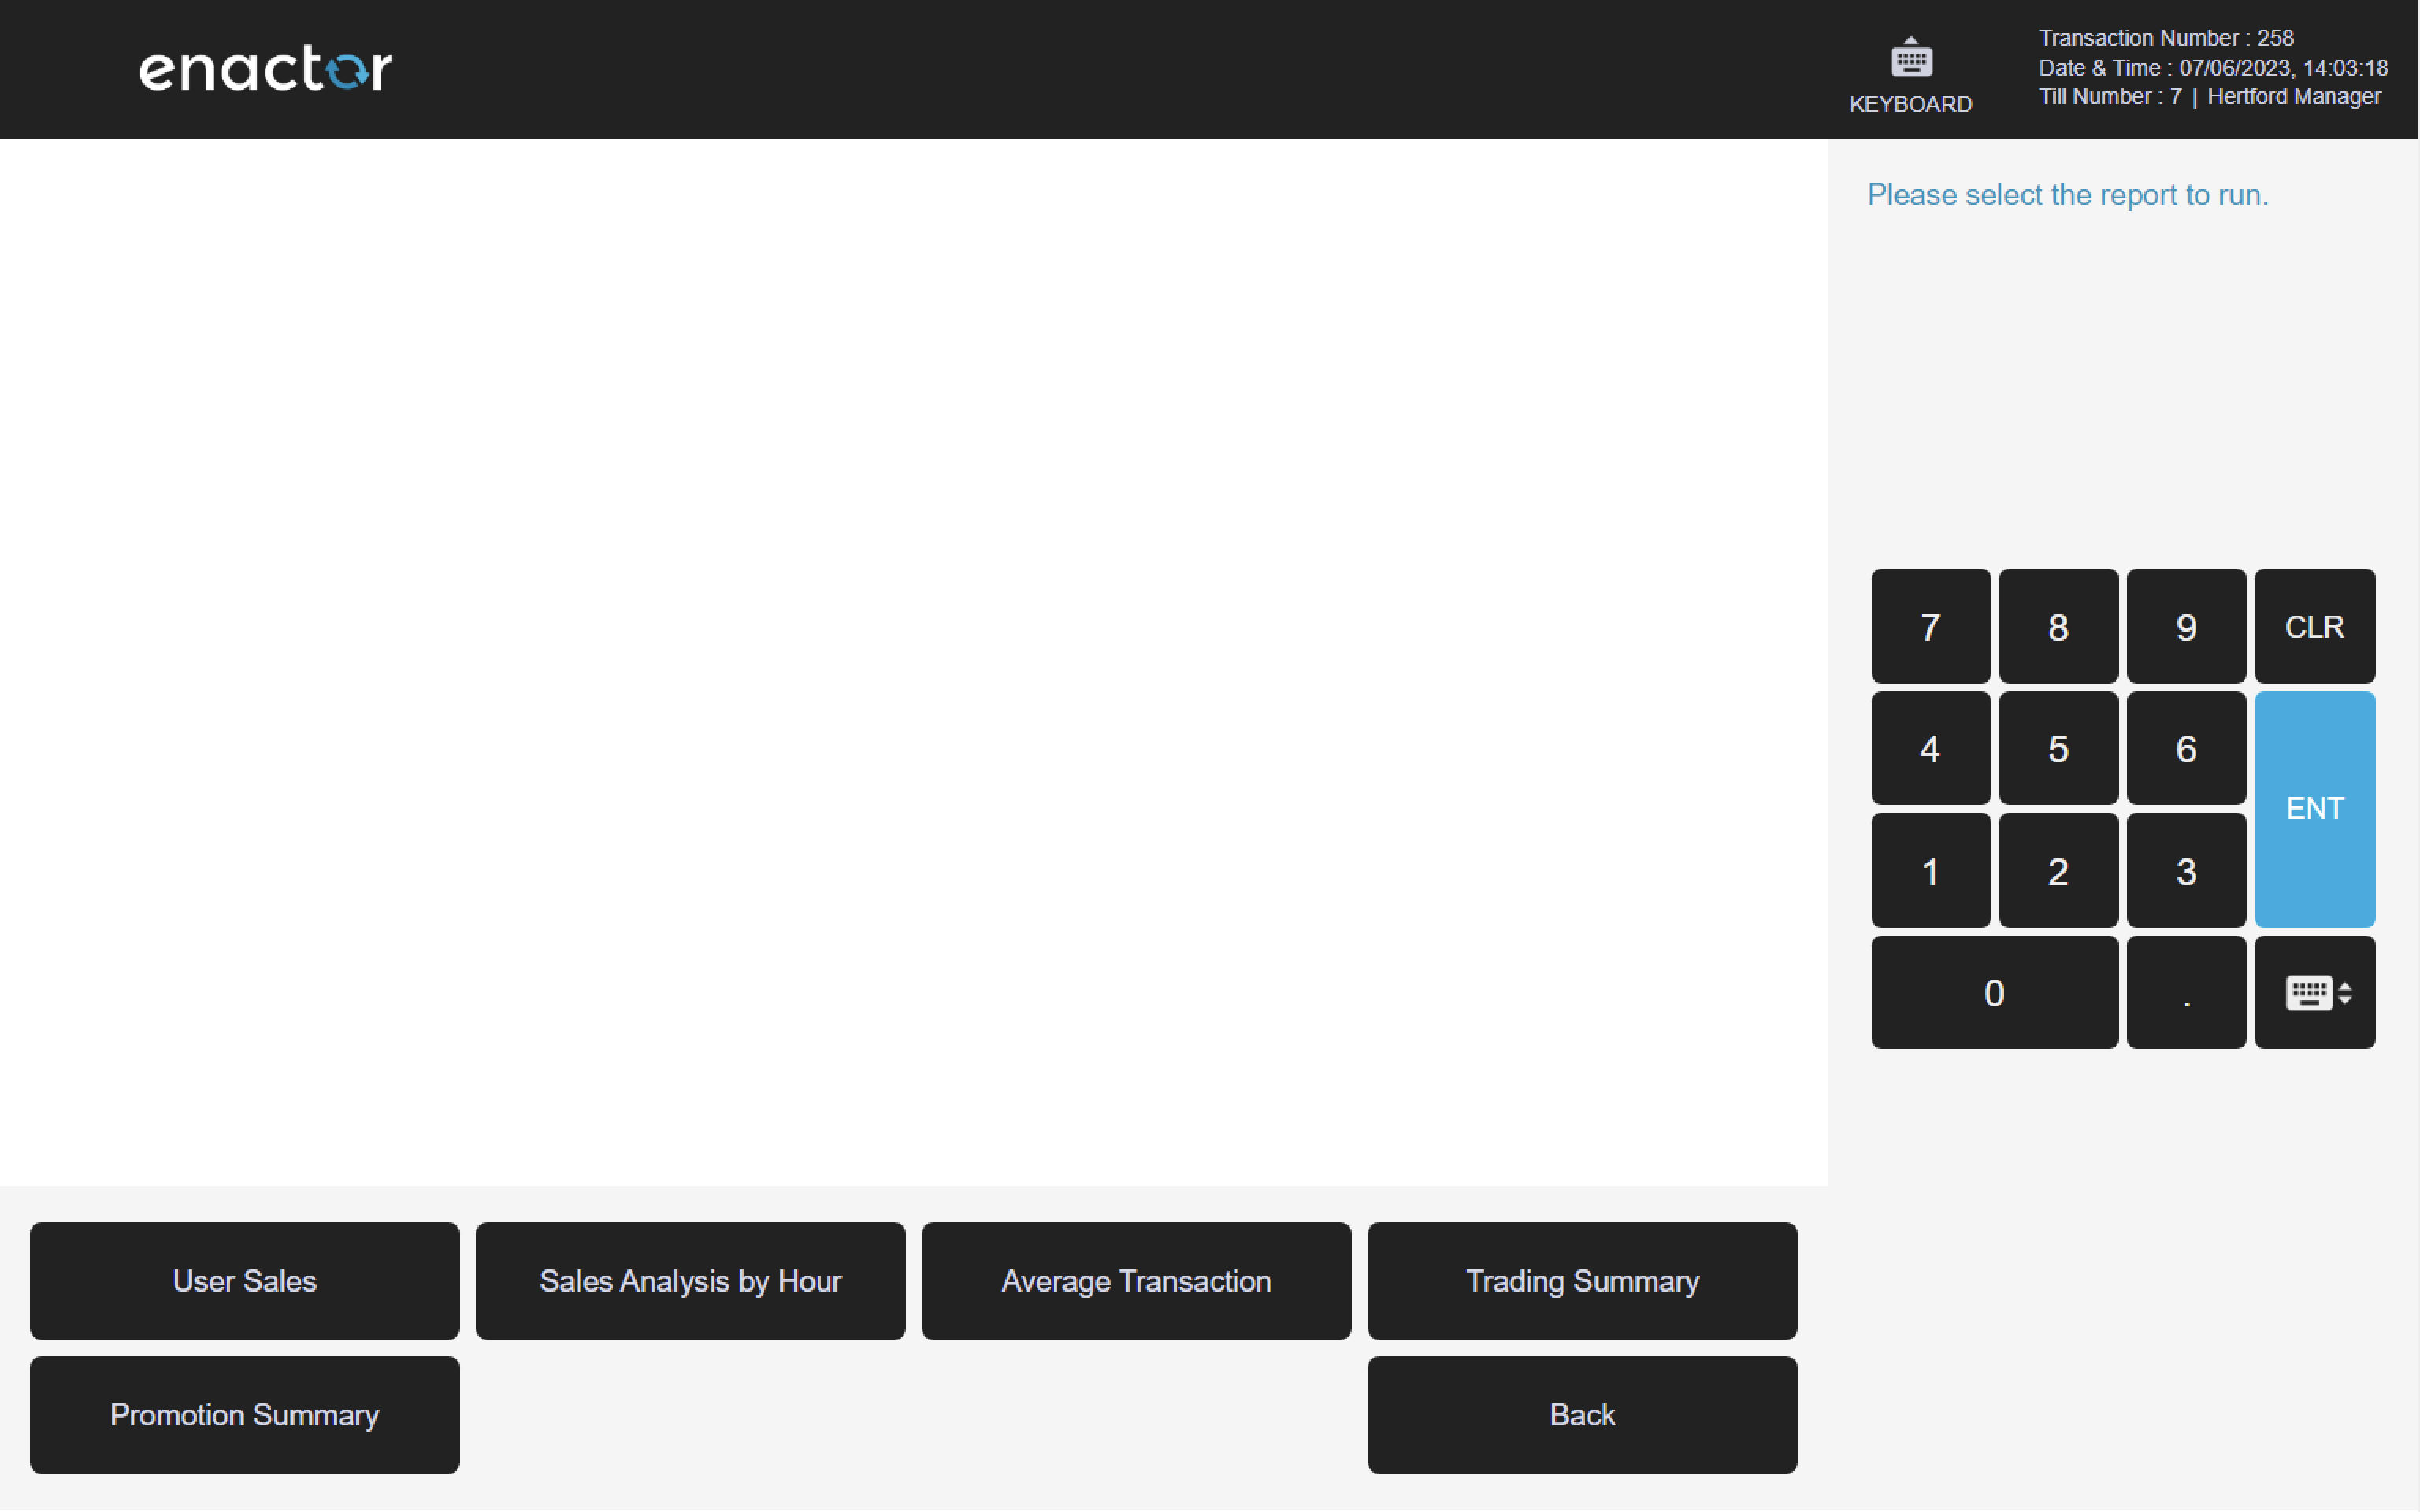
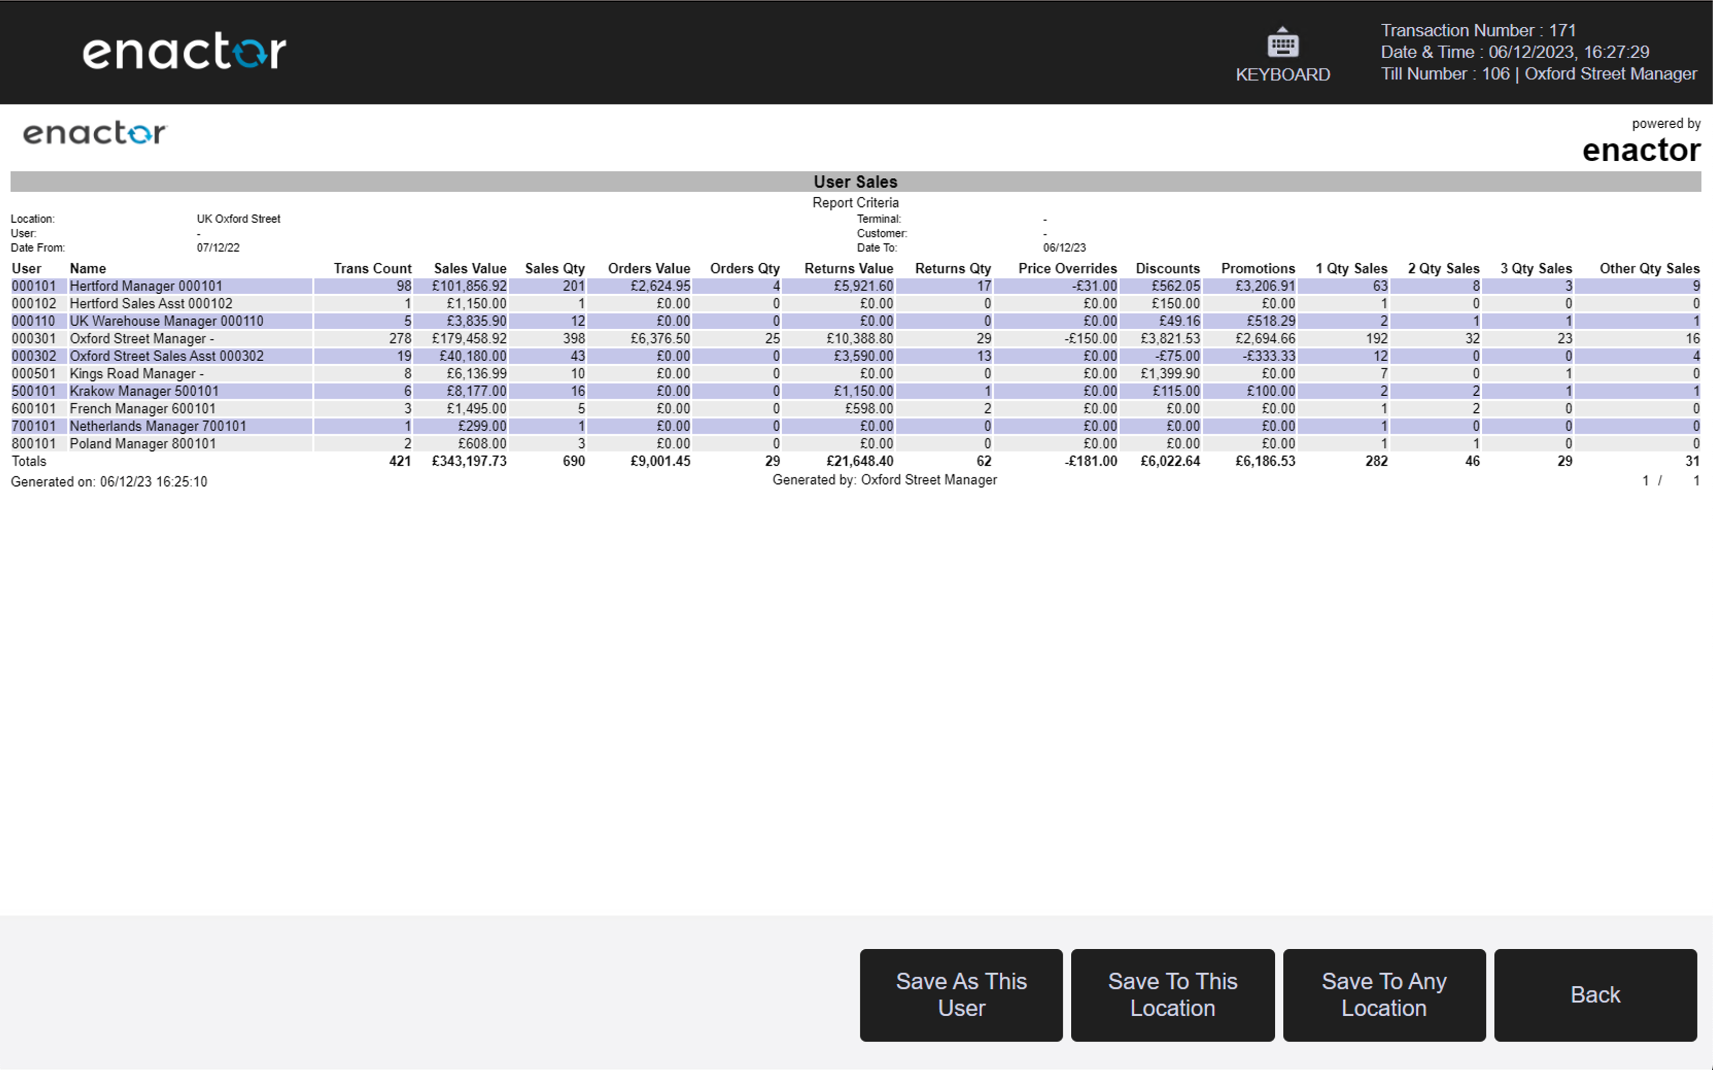
2.1 User Sales
Path: Sales Reports > User Sales
View user sales information.
Filter Criteria
| Property | Description |
|---|---|
| Location | Dropdown selection of available locations. |
| Terminal | Dropdown selection of terminals, filtered by the selected location. |
| User / Salesperson | Dropdown selection of user or salesperson. |
| User Mode | Dropdown to specify whether to report by User or Salesperson (defaults to User). |
| Customer | Dropdown selection of customer. |
| Date Range | Date range selector with from/to date inputs. |

Output Columns
| Property | Description |
|---|---|
| User | The user identifier. |
| Name | The name of the user. |
| Trans Count | The total number of transactions for the user within the selected period. |
| Sales Value | The total sales value for the user. |
| Sales Qty | The total sales quantity for the user. |
| Orders Value | The total orders value for the user. |
| Orders Qty | The total orders quantity for the user. |
| Returns Value | The total returns value for the user. |
| Returns Qty | The total returns quantity for the user. |
| Price Overrides | The total value of price overrides applied by the user. |
| Discounts | The total discounts value applied by the user. |
| Promotions | The total promotions value applied by the user. |
| 1 Qty Sales | The number of single-item transactions for the user. |
| 2 Qty Sales | The number of two-item transactions for the user. |
| 3 Qty Sales | The number of three-item transactions for the user. |
| Other Qty Sales | The number of transactions with four or more items for the user. |
Grand totals are shown at the bottom of each column.
2.2 Sales Analysis by Hour
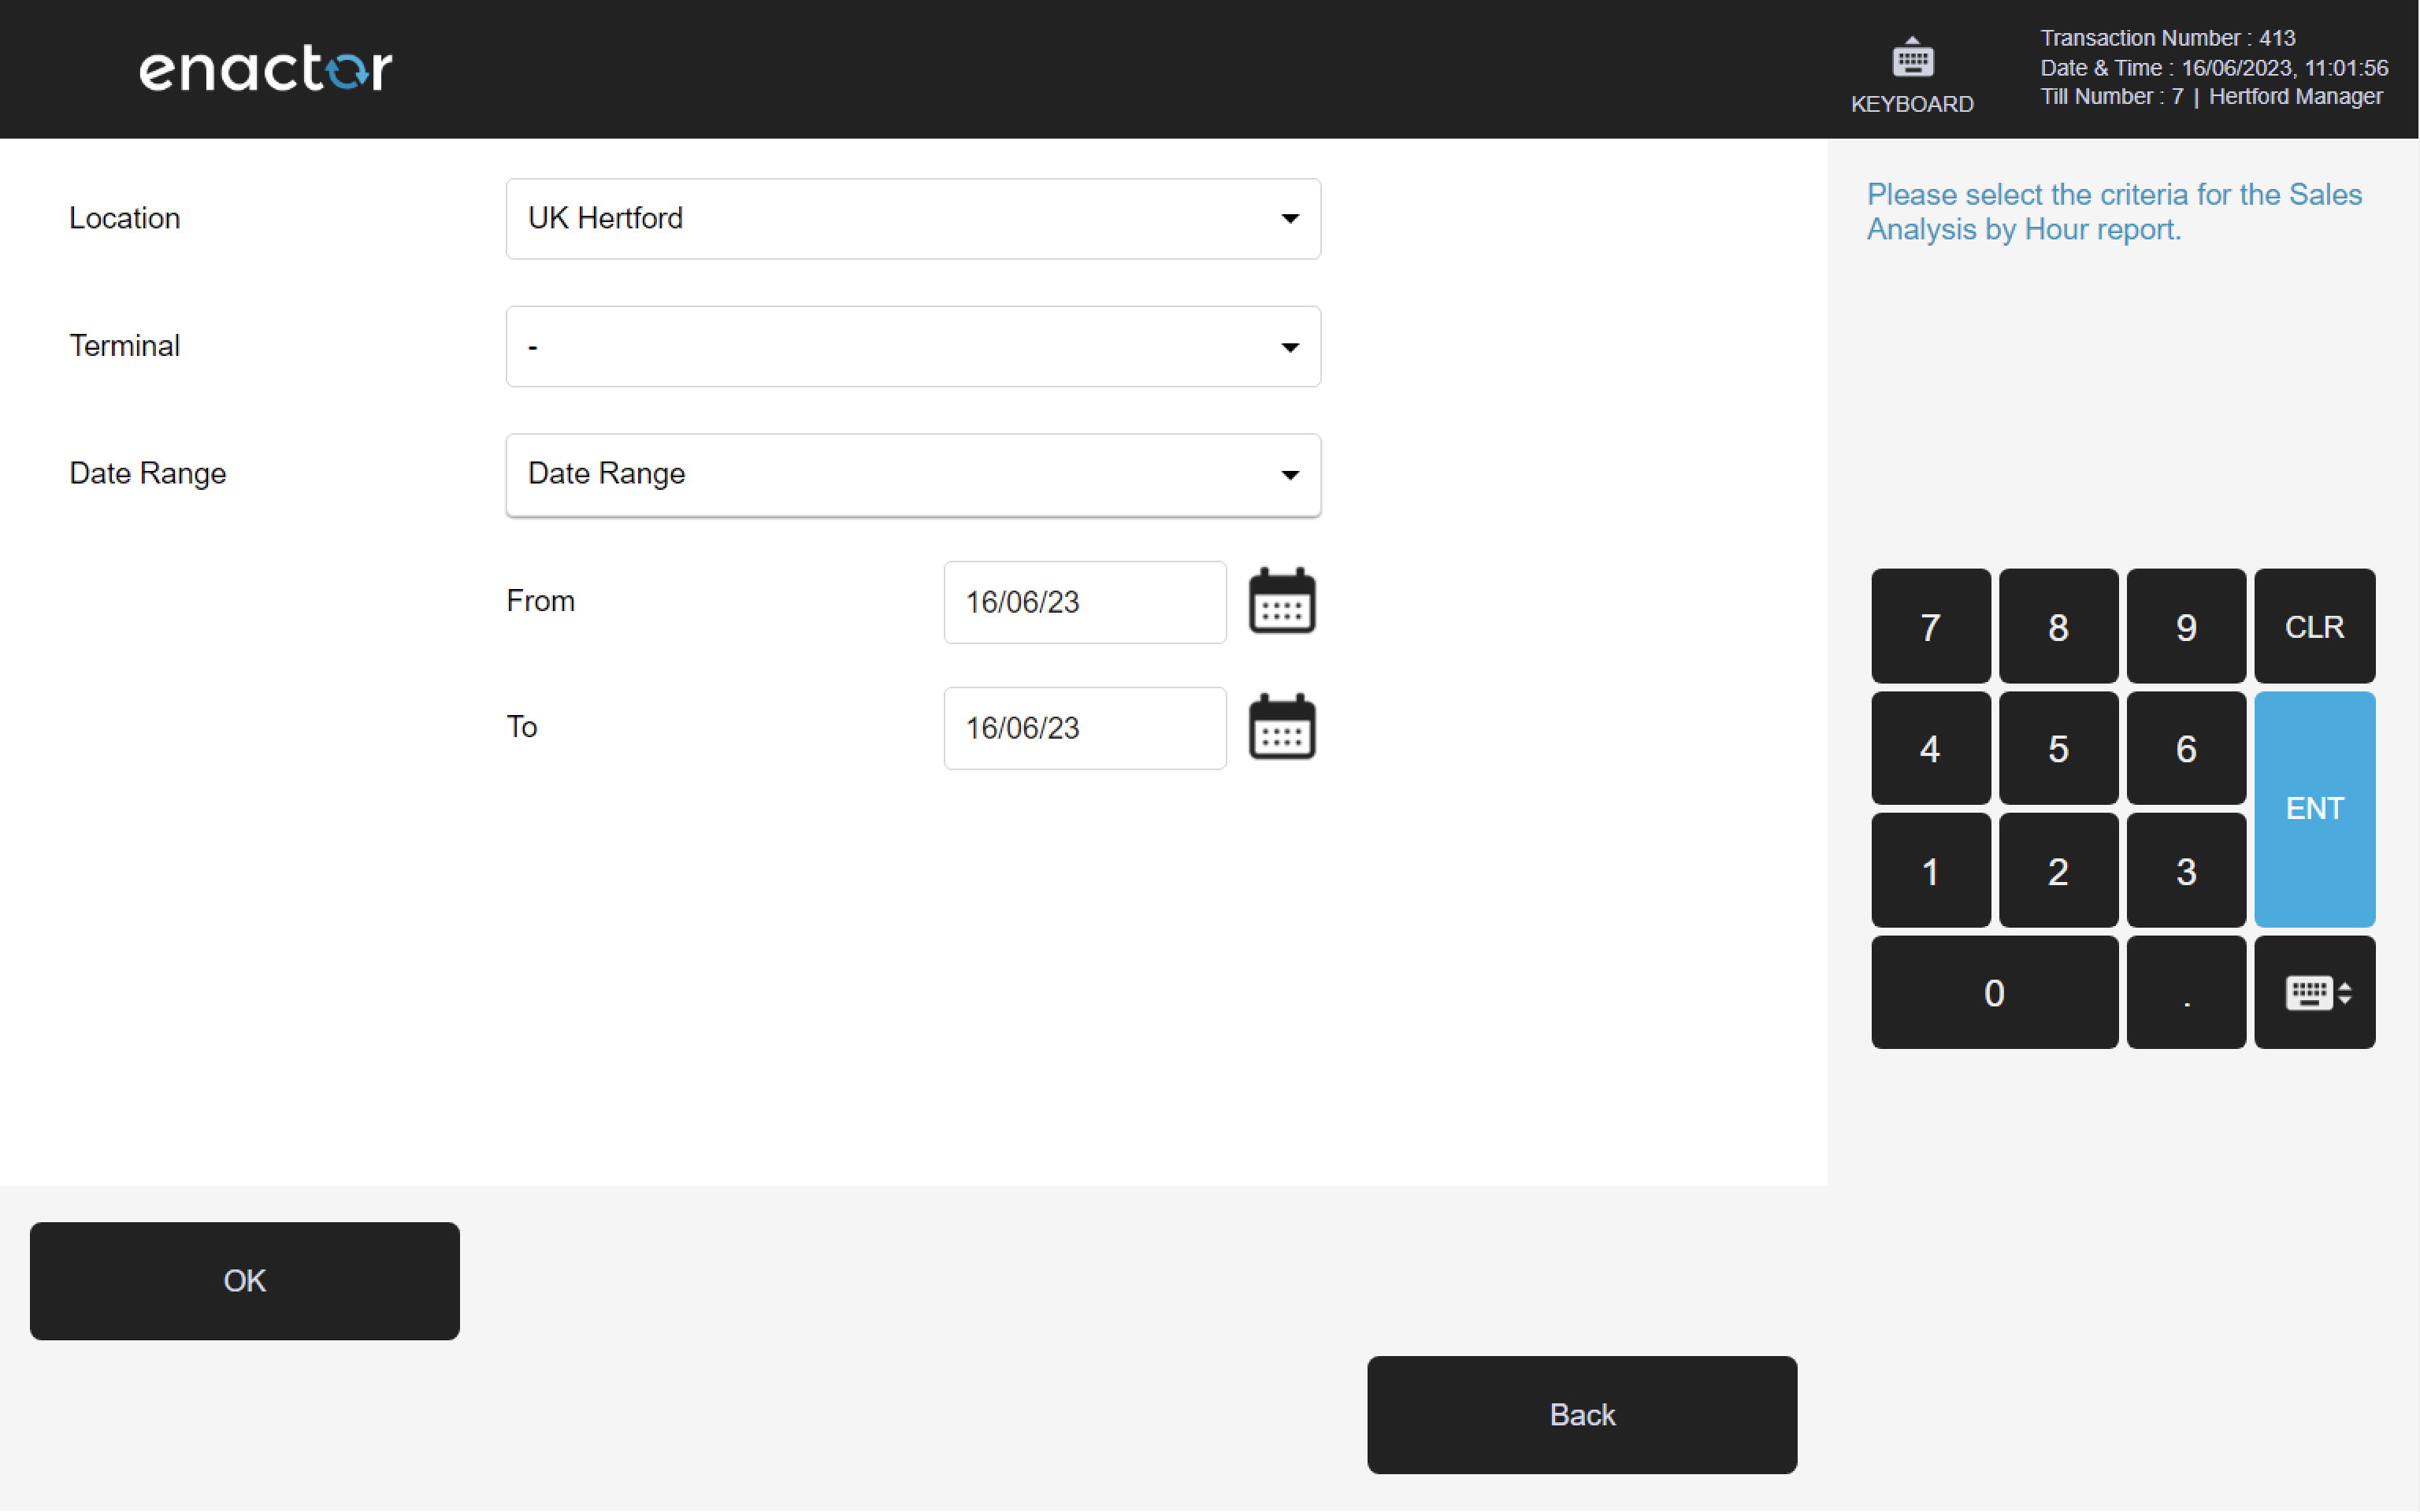
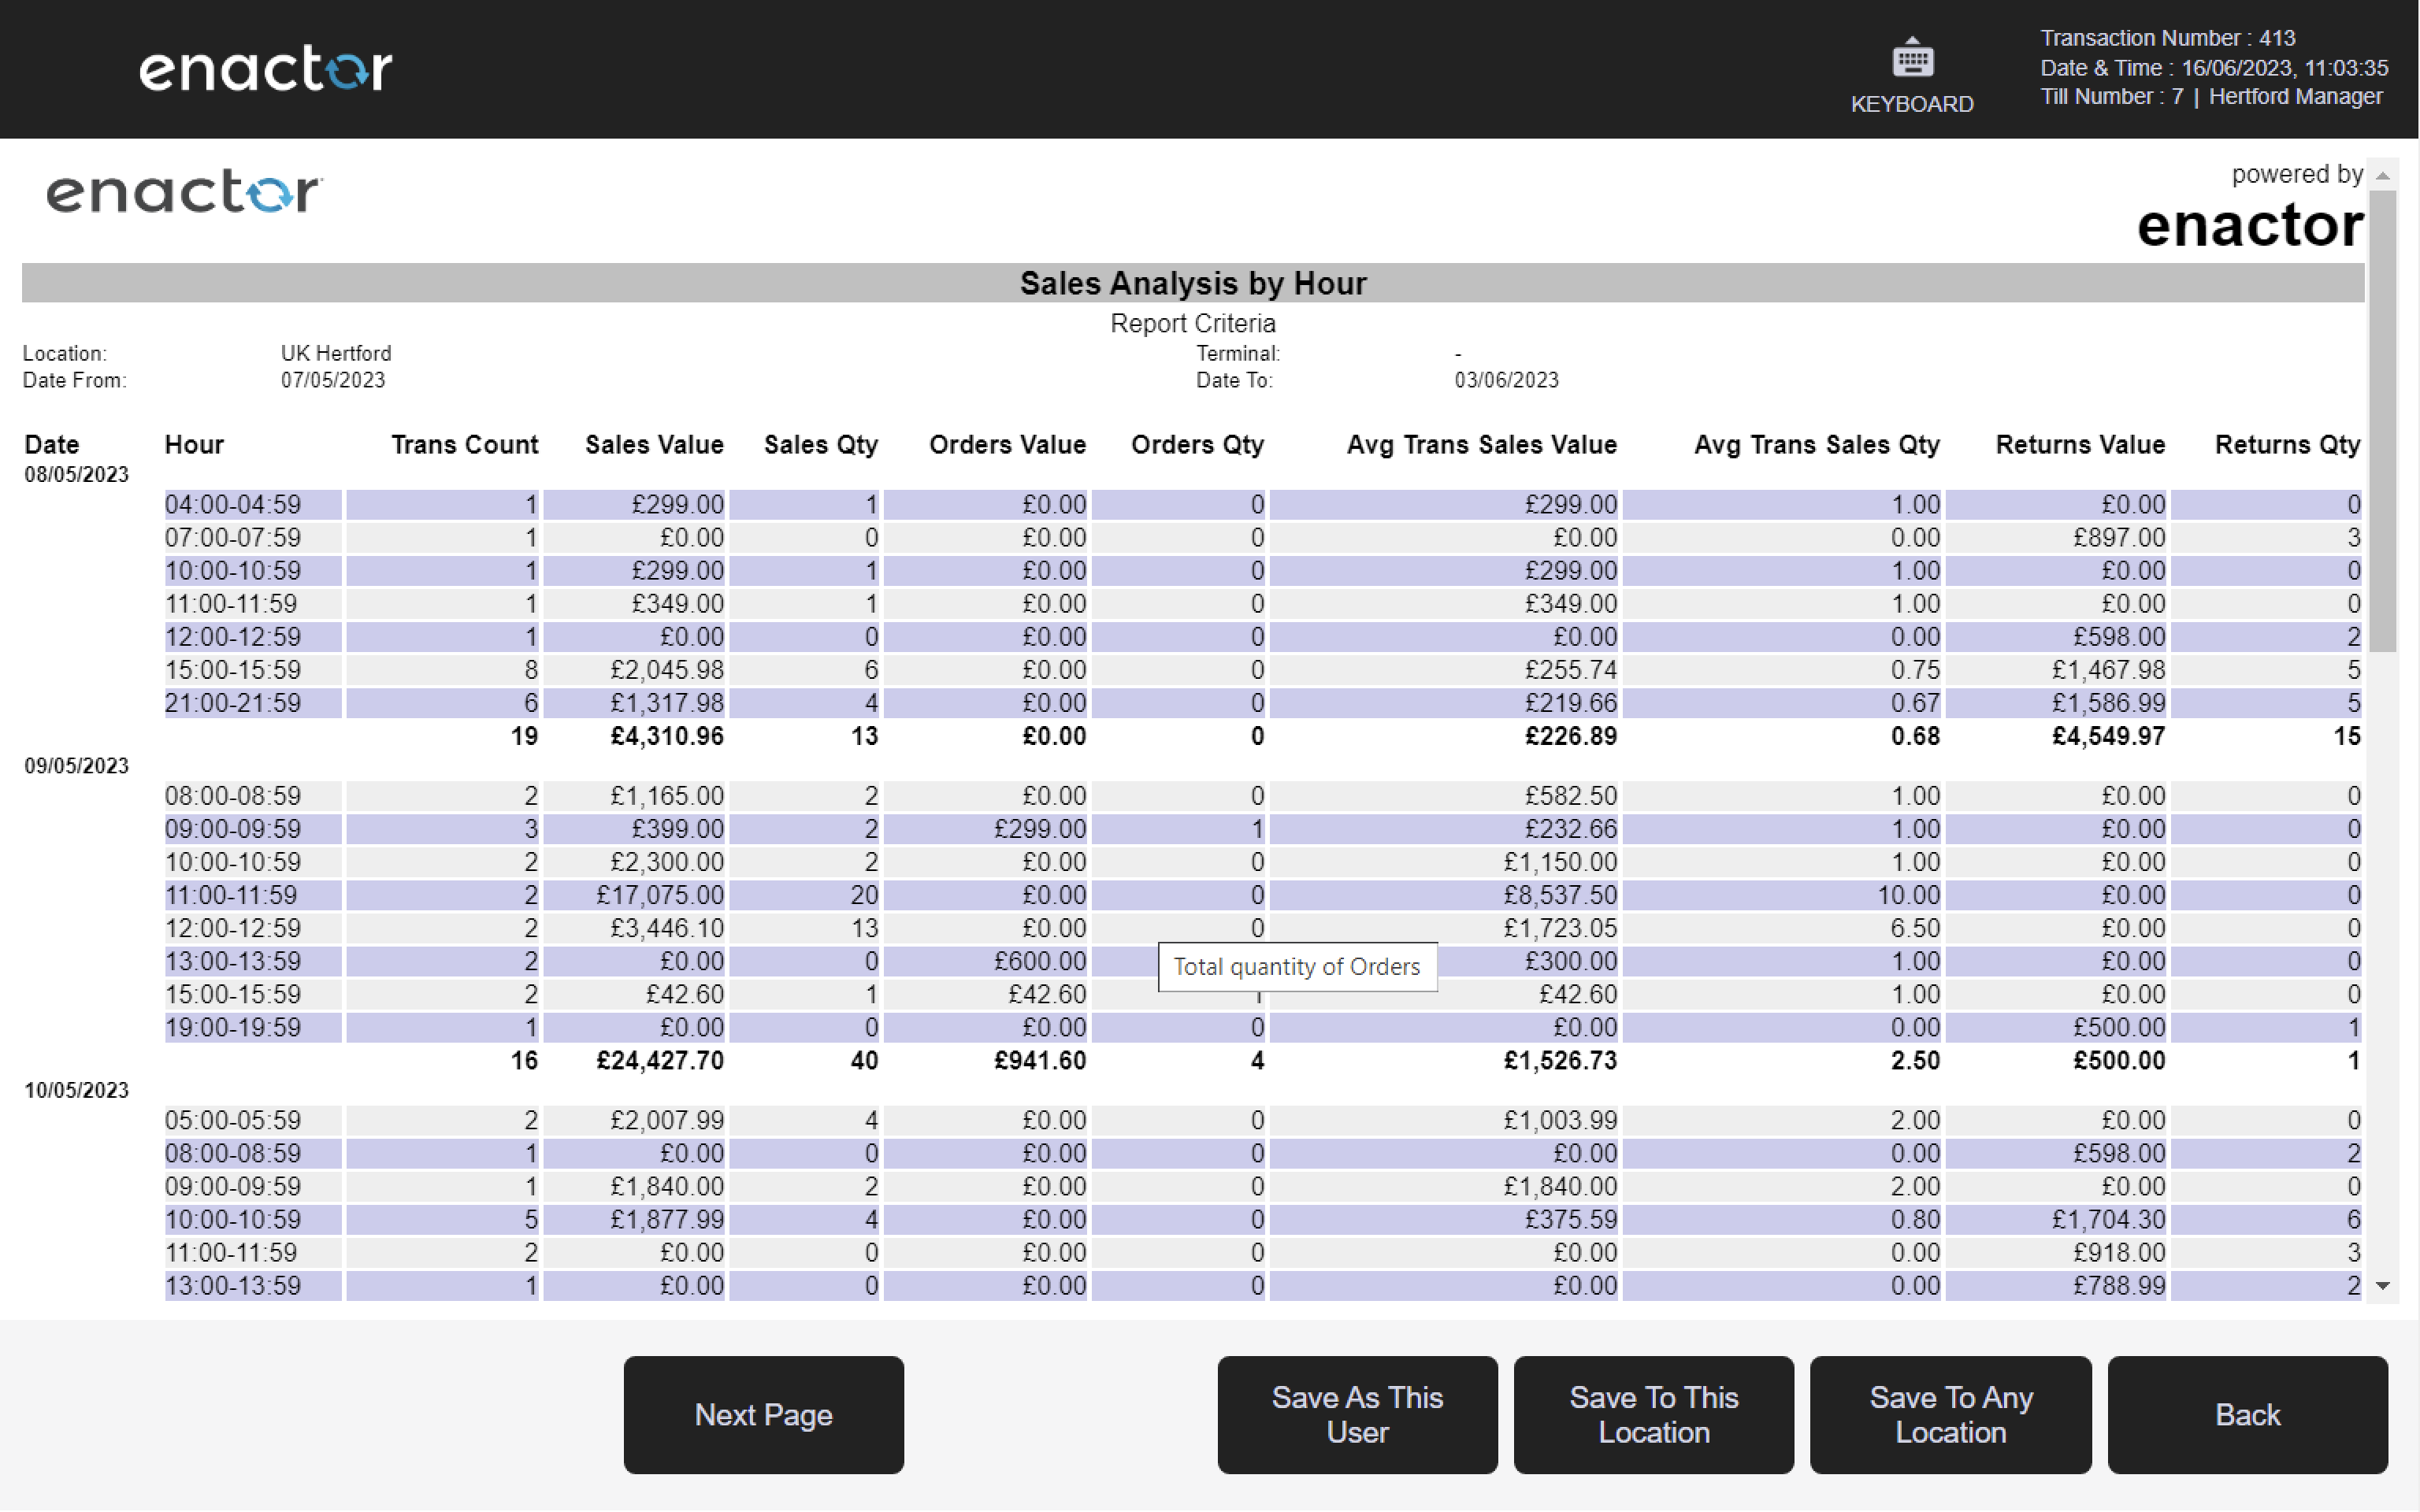
Path: Sales Reports > Sales Analysis by Hour
View sales analysis by hour information.
Filter Criteria
| Property | Description |
|---|---|
| Location | Dropdown selection of available locations. |
| Terminal | Dropdown selection of terminals, filtered by the selected location. |
| Date Range | Date range selector with from/to date inputs. |
Output Columns
| Property | Description |
|---|---|
| Date | The date of the sales data. |
| Hour | The hour of the day for the sales data. |
| Trans Count | The total number of transactions within that hour. |
| Sales Value | The total sales value within that hour. |
| Sales Qty | The total sales quantity within that hour. |
| Orders Value | The total orders value within that hour. |
| Orders Qty | The total orders quantity within that hour. |
| Avg Trans Sales Value | The average transaction sales value within that hour. |
| Avg Trans Sales Qty | The average transaction sales quantity within that hour. |
| Returns Value | The total returns value within that hour. |
| Returns Qty | The total returns quantity within that hour. |
2.3 Average Transaction
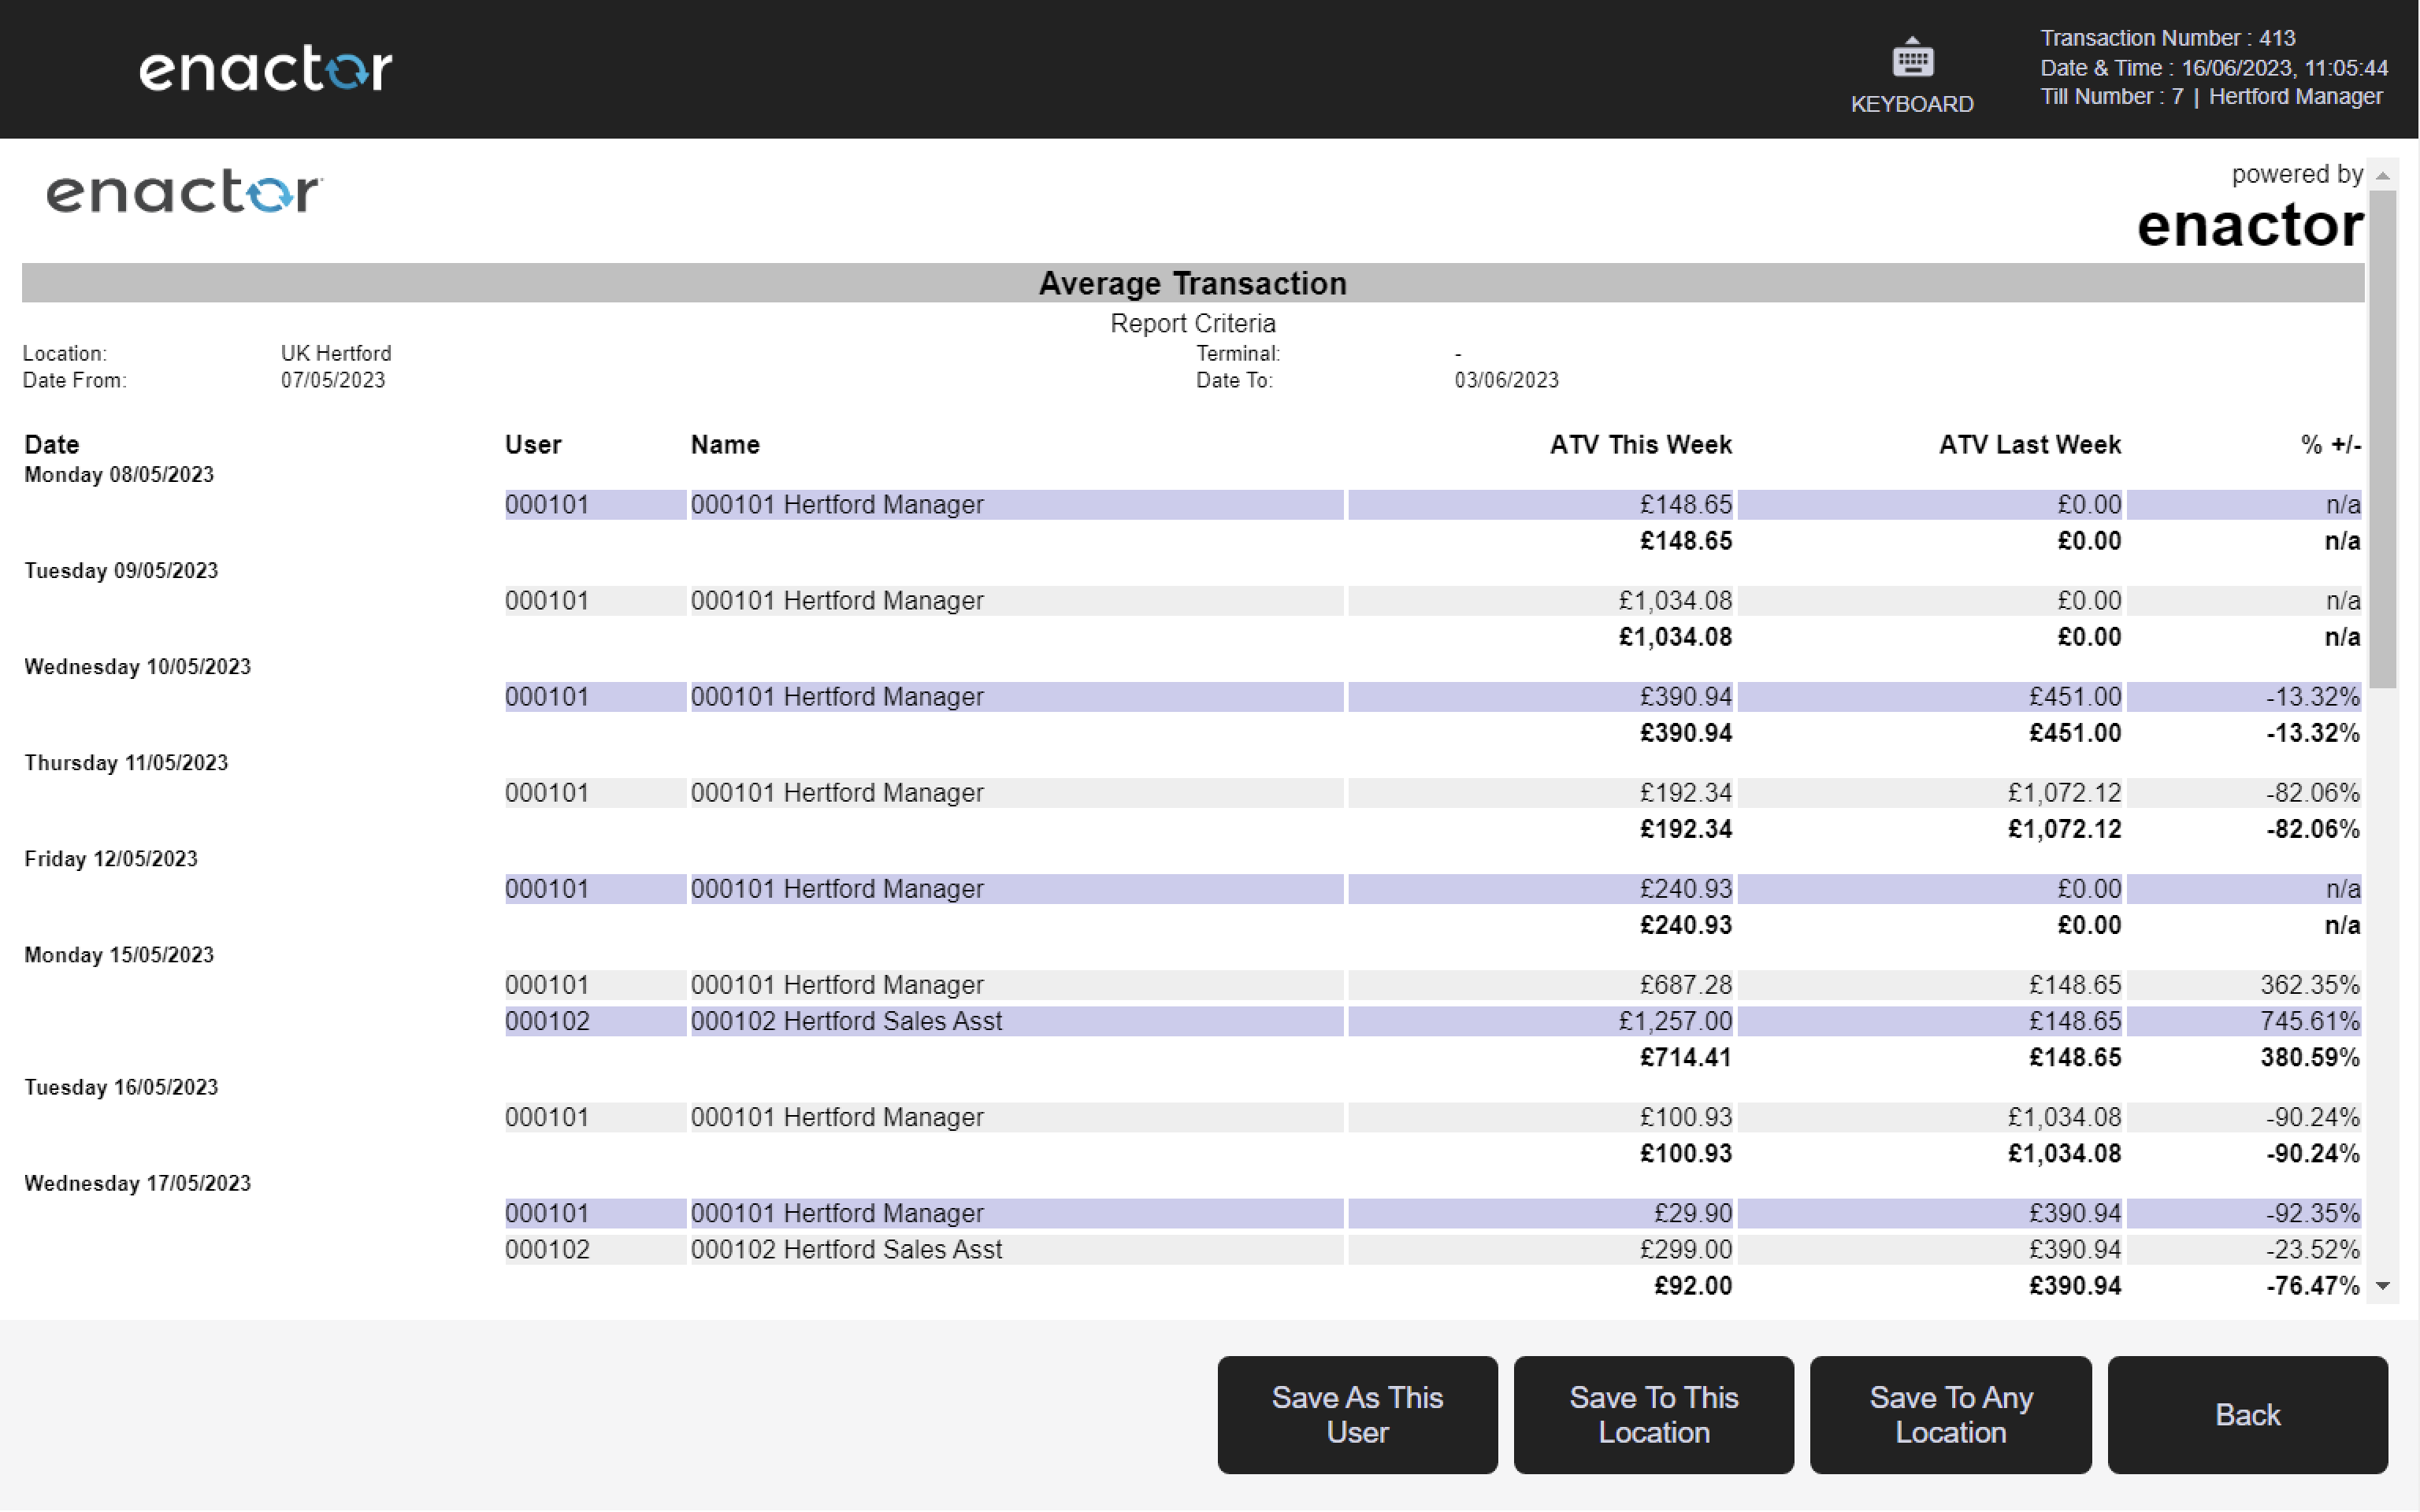
Path: Sales Reports > Average Transaction
View average transaction value information.
Filter Criteria
| Property | Description |
|---|---|
| Location | Dropdown selection of available locations. |
| Terminal | Dropdown selection of terminals, filtered by the selected location. |
| Date Range | Date range selector with from/to date inputs. |

Output Columns
| Property | Description |
|---|---|
| Date | The date of the transaction data. |
| User | The user identifier. |
| Name | The name of the user. |
| ATV This Week | The average transaction value for the current week. |
| ATV Last Week | The average transaction value for the equivalent period in the previous week. |
| % +/- | The percentage change in average transaction value between this week and last week. |
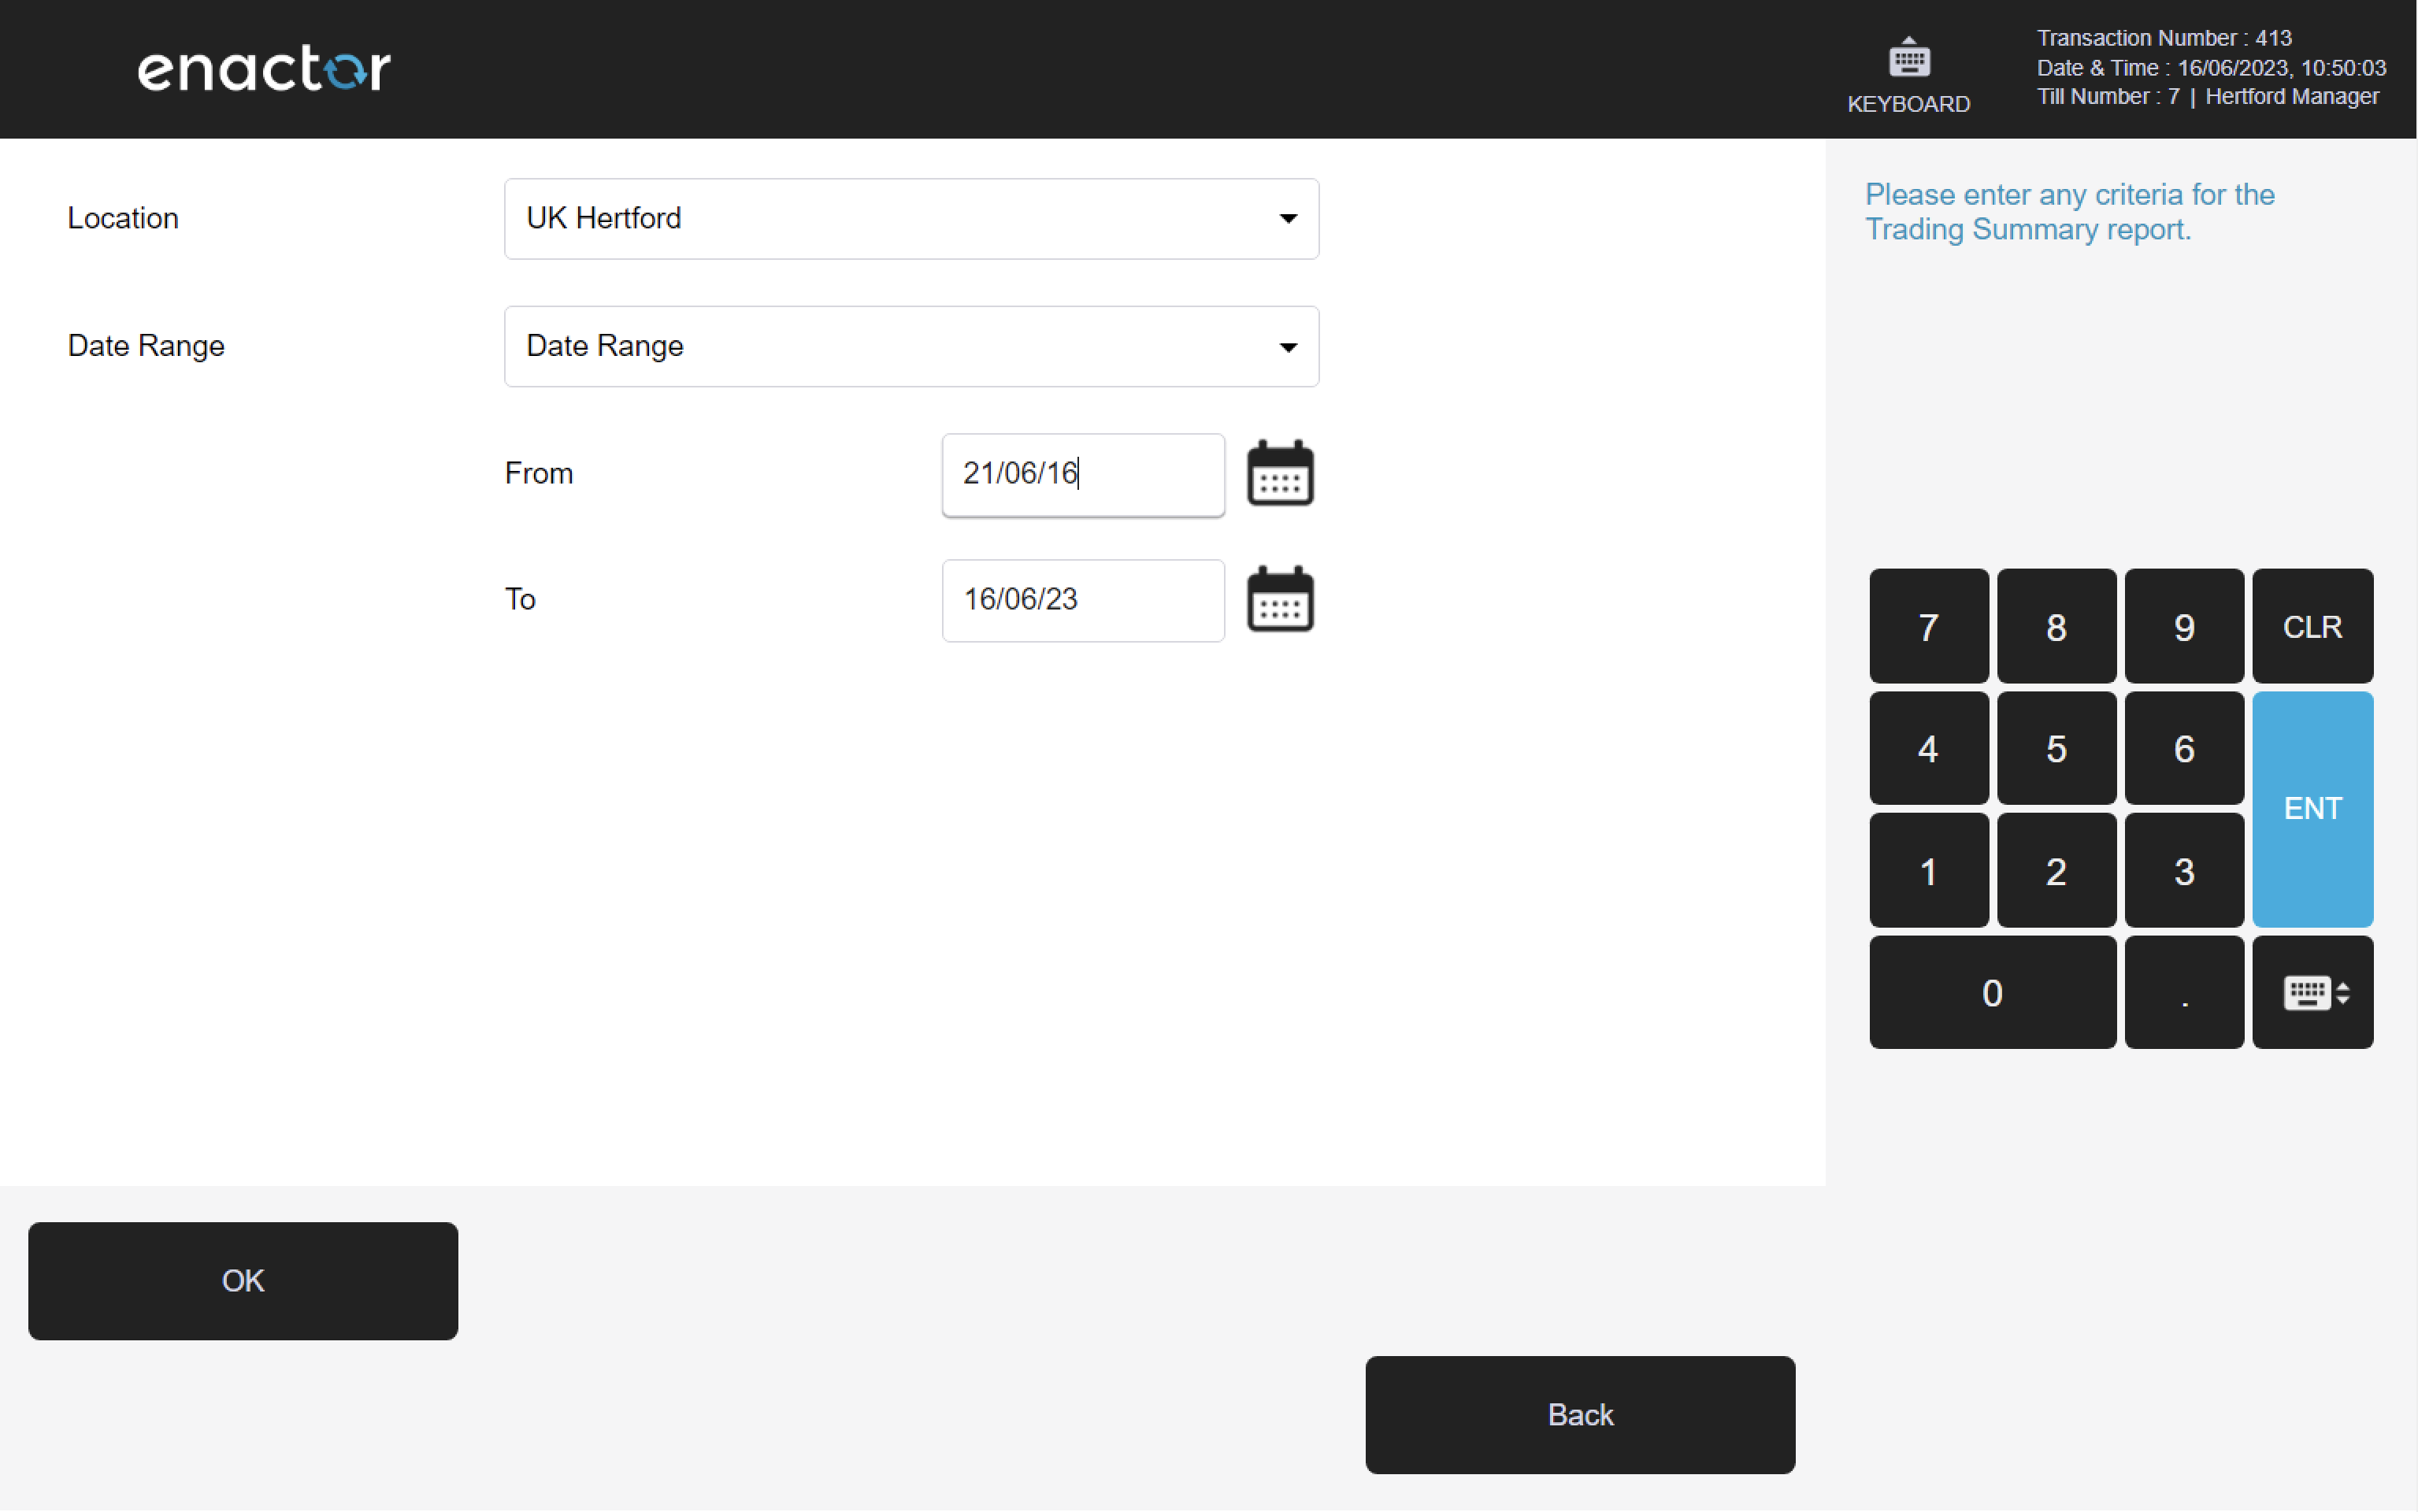
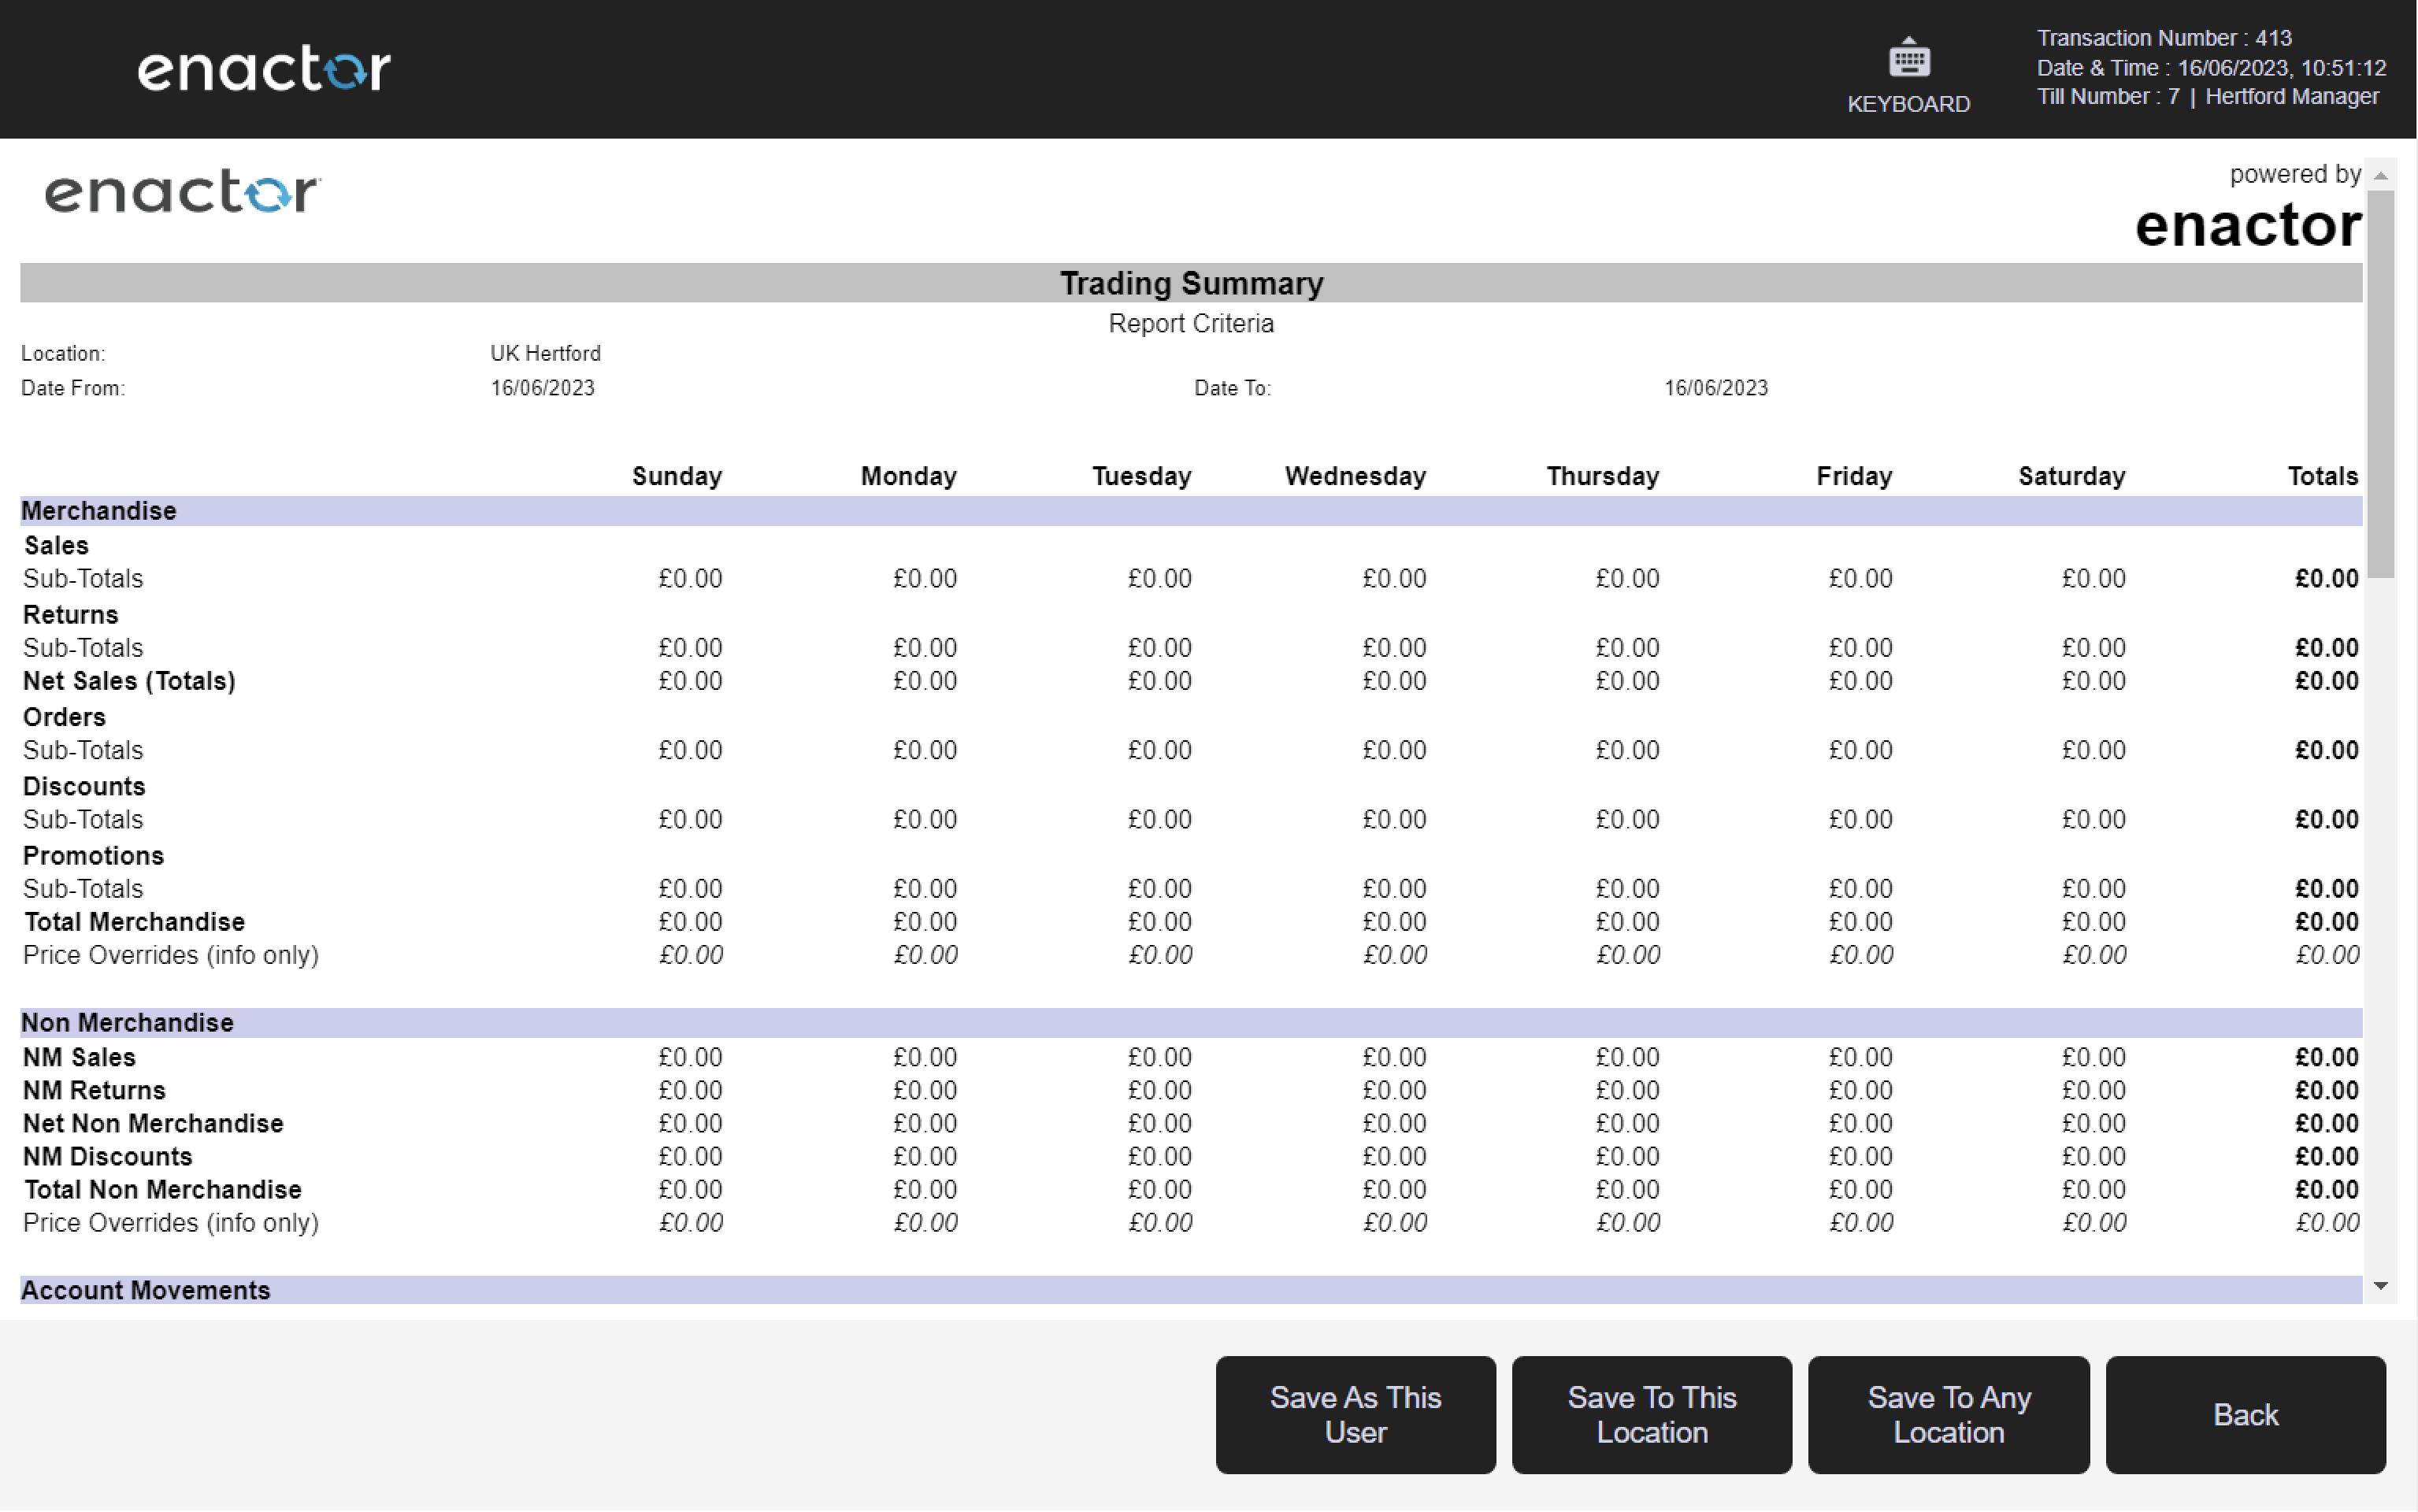
2.4 Trading Summary
Path: Sales Reports > Trading Summary
View trading summary information. The results table presents a column for each day of the selected date range.
Filter Criteria
| Property | Description |
|---|---|
| Location | Dropdown selection of available locations. |
| Date Range | Date range selector with from/to date inputs. |

Output Columns
The Trading Summary report presents rows grouped into the following sections, with a column for each day of the week across the selected period:
| Section / Row | Description |
|---|---|
| Merchandise | |
| Sales | Total merchandise sales value per day. |
| Returns | Total merchandise returns value per day. |
| Net Sales | Net merchandise sales (sales minus returns) per day. |
| Discounts | Total merchandise discounts per day. |
| Promotions | Total merchandise promotions per day. |
| Total Merchandise | Combined merchandise total per day. |
| Non Merchandise | |
| Sales | Total non-merchandise sales value per day. |
| Returns | Total non-merchandise returns value per day. |
| Net | Net non-merchandise value per day. |
| Discounts | Total non-merchandise discounts per day. |
| Total | Combined non-merchandise total per day. |
| Account Movements | |
| Customer Account Payments | Total customer account payments per day. |
| Customer Account Withdrawals | Total customer account withdrawals per day. |
| All Sales | Combined totals of all merchandise and non-merchandise per day. |
| Terminal Cash Management | |
| Incomes | Total terminal income transactions per day. |
| Expenses | Total terminal expense transactions per day. |
| Net | Net terminal cash management value per day. |
| Total Trading | Total trading value per day. |
| Customer Count | Total number of customer transactions per day. |
| Terminal Declaration | |
| Opening Floats | Opening float value per day. |
| Extra Floats | Extra float value added during the day. |
| Pickups | Total pickup value per day. |
| Closing Float | Closing float value per day. |
| Total Receipts | Total receipts per day. |
| Total Trading | Total terminal trading per day. |
| Overs and Unders | Discrepancy between declared and expected values per day. |
| Safe Cash Management | |
| Incomes | Total safe income transactions per day. |
| Expenses | Total safe expense transactions per day. |
| Adjustments | Total safe adjustment transactions per day. |
| Currency Purchases | Total currency purchase value per day. |
| Safe Declaration | |
| Opening Balance | Safe opening balance per day. |
| Banking | Total banking value per day. |
| Closing Balance | Safe closing balance per day. |
| Total Accounted For | Total value accounted for in the safe per day. |
| Closing Store Floats | |
| Cash in Safe | Total cash held in the safe at close per day. |
| Other Tenders in Safe | Total non-cash tenders held in the safe at close per day. |
| Cash in Drawers | Total cash held in till drawers at close per day. |
| Other Tenders in Drawers | Total non-cash tenders held in drawers at close per day. |
| Total Monies | Total monies at close per day. |
| Weekly Total | Accumulated weekly total column. |

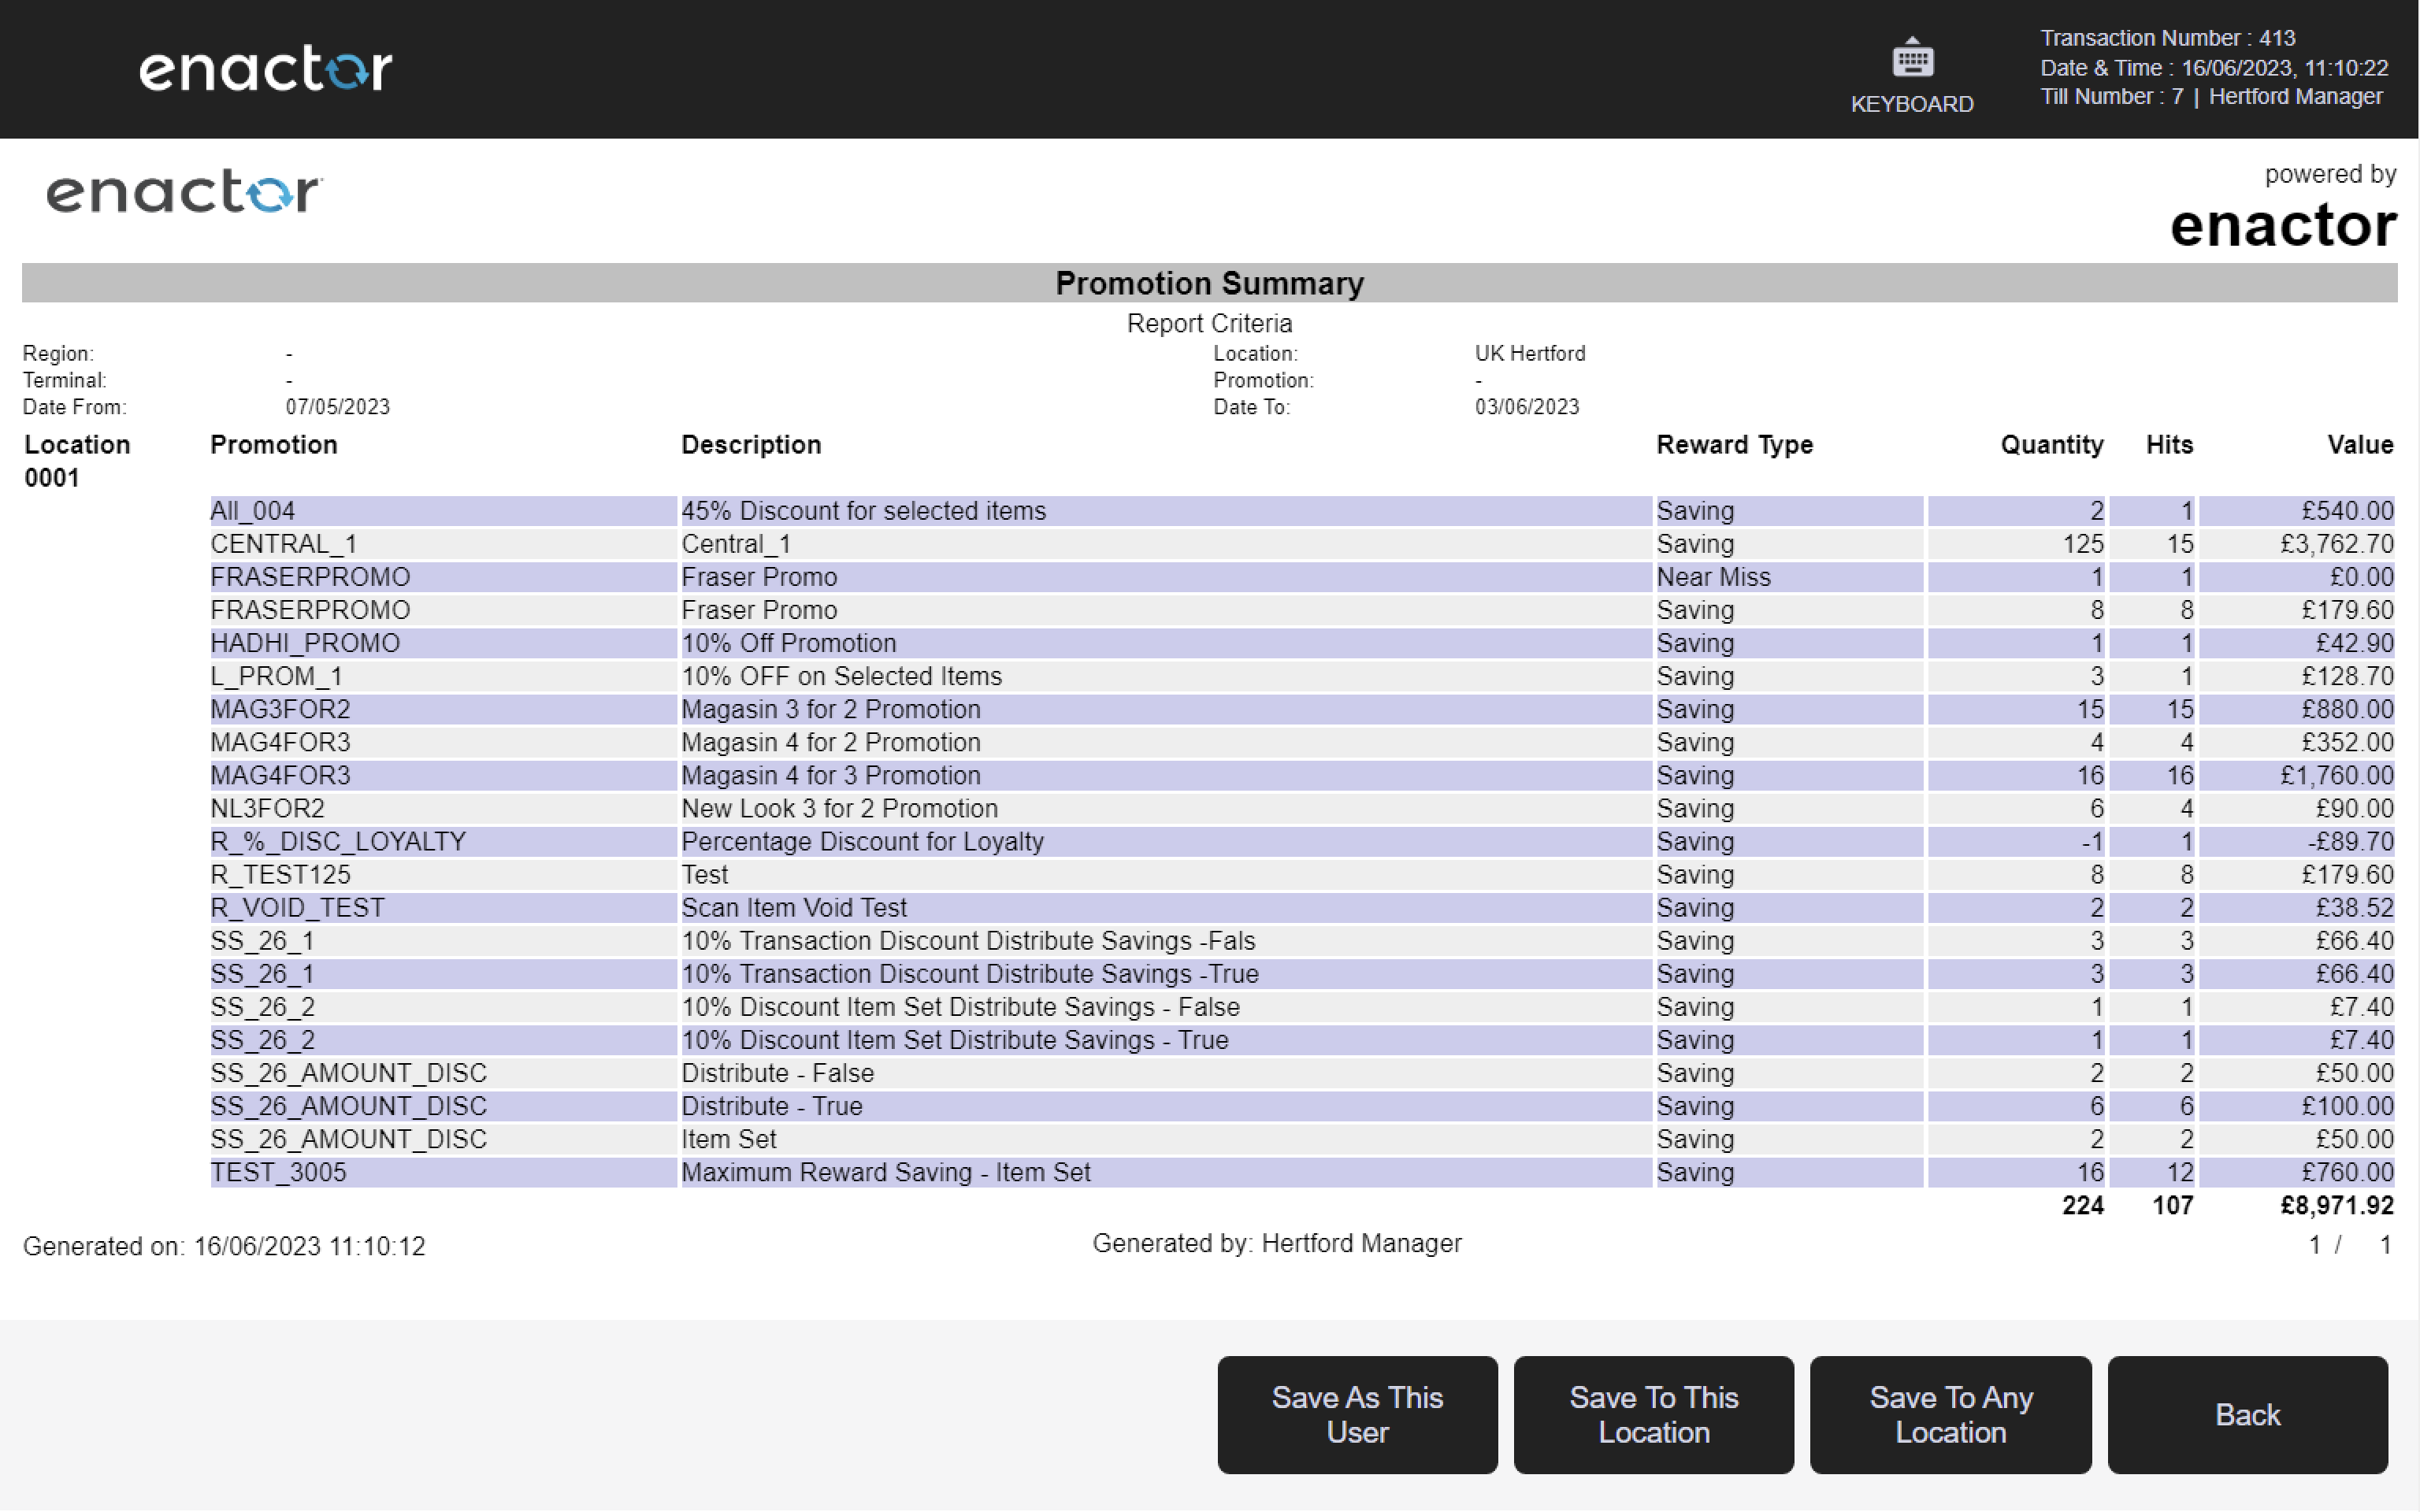
2.5 Promotion Summary
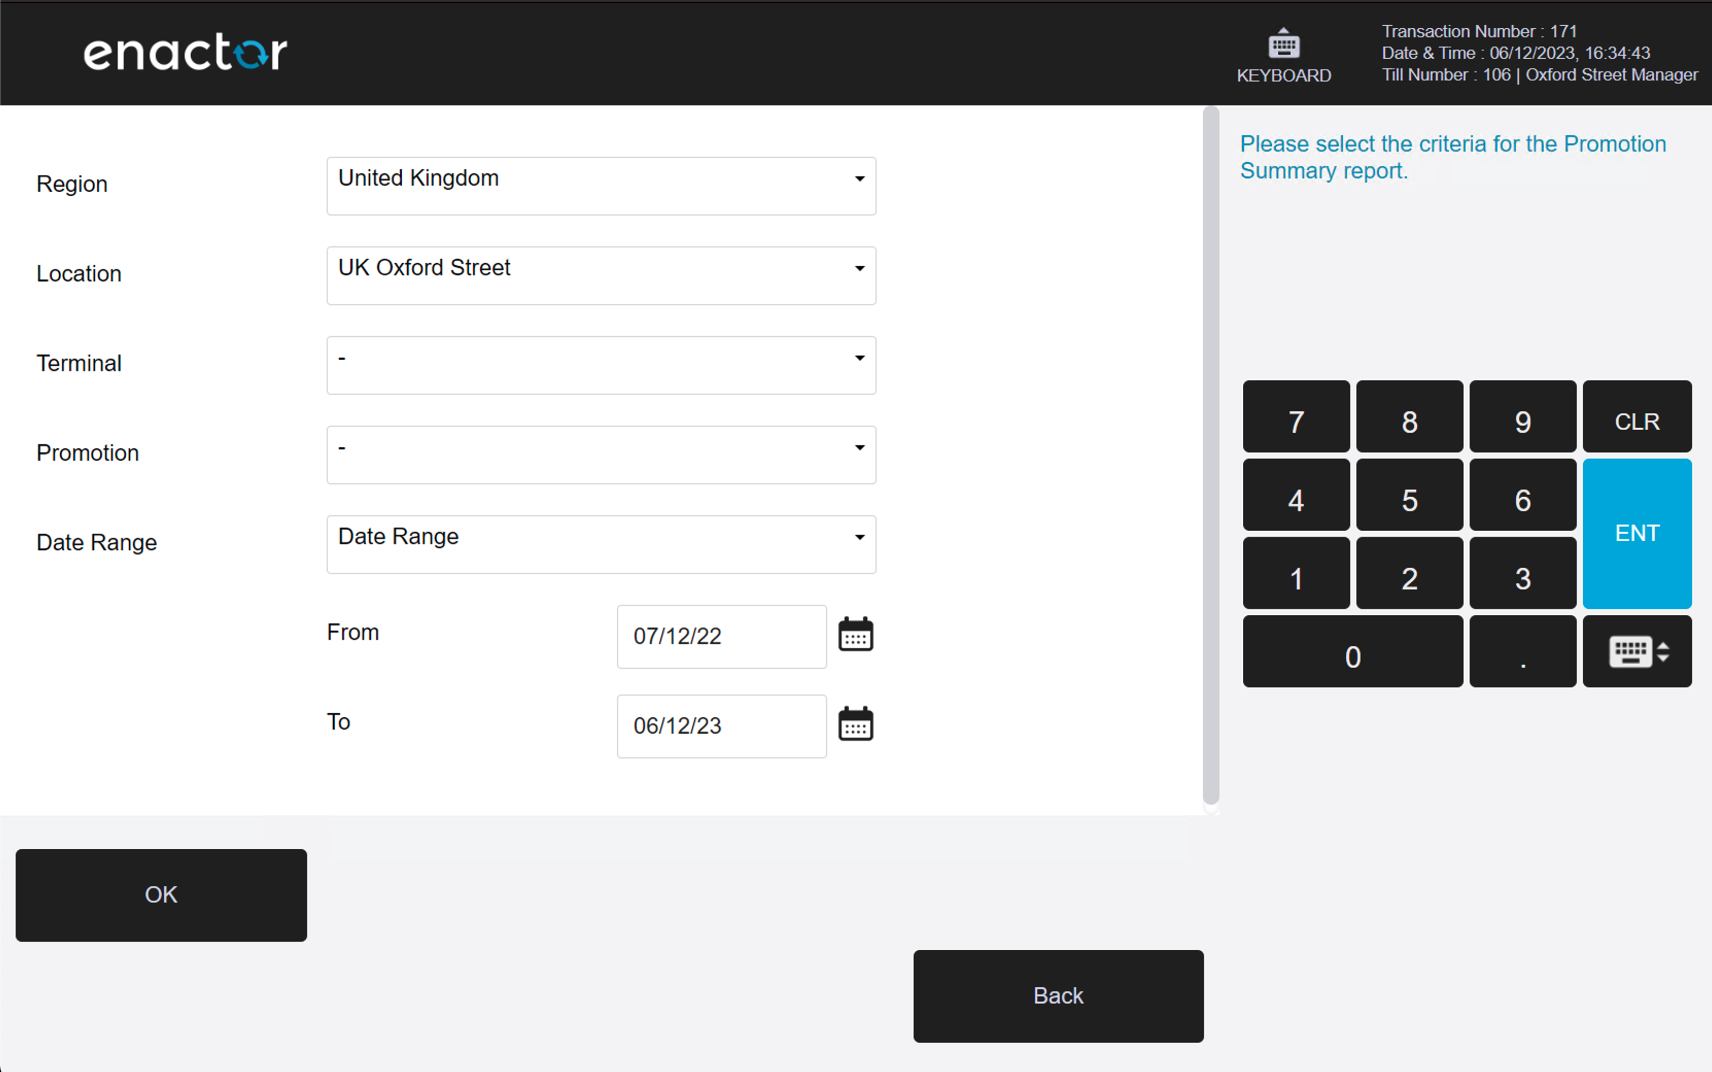
Path: Sales Reports > Promotion Summary
View promotion summary information.
Filter Criteria
| Property | Description |
|---|---|
| Region | Dropdown selection of available regions. |
| Location | Dropdown selection of locations, filtered by the selected region. |
| Terminal | Dropdown selection of terminals, filtered by the selected location. |
| Promotion | Dropdown selection of promotion. |
| Date Range | Date range selector with from/to date inputs. |
Output Columns
| Property | Description |
|---|---|
| Location | The location where the promotion was applied. |
| Promotion | The promotion identifier. |
| Description | The description of the promotion. |
| Reward Type | The type of reward associated with the promotion. |
| Quantity | The total quantity from promotion triggers within the selected period. |
| Hits | The total number of times the promotion was triggered. |
| Value | The total reward value or points awarded by the promotion. Grand totals are shown at the bottom. |
3 Tender Reports
Path: Web Reports > Tender Reports
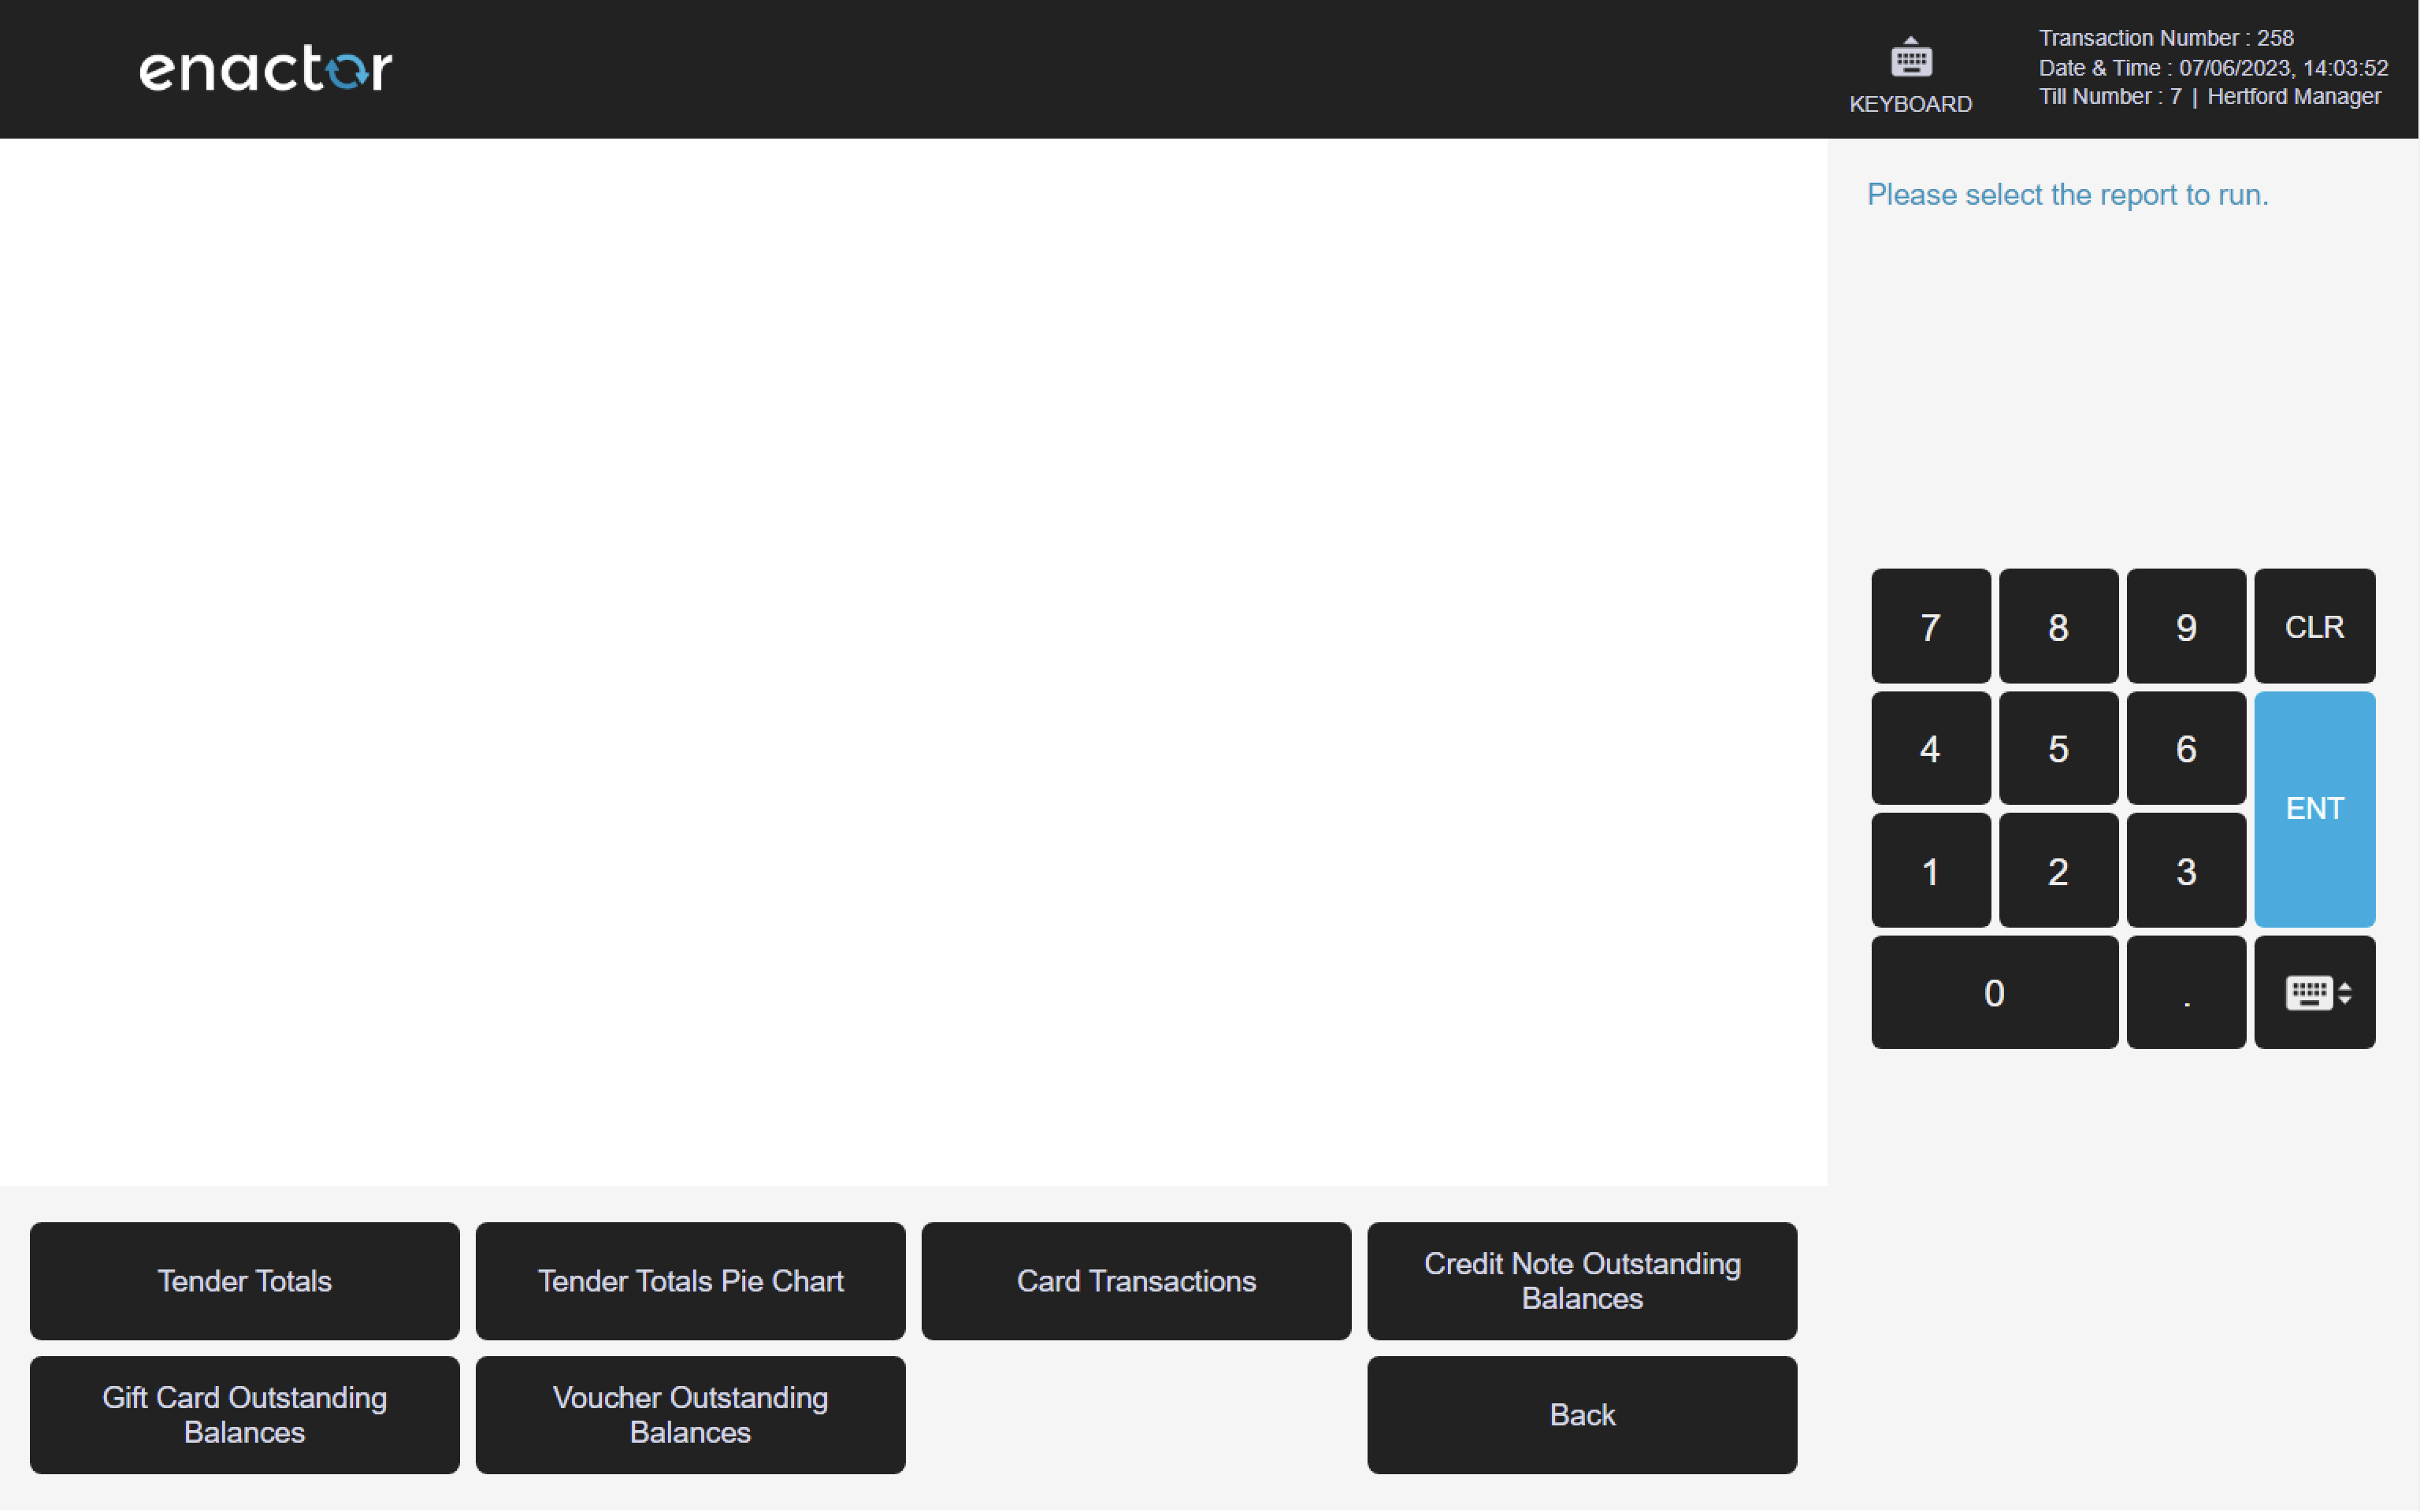
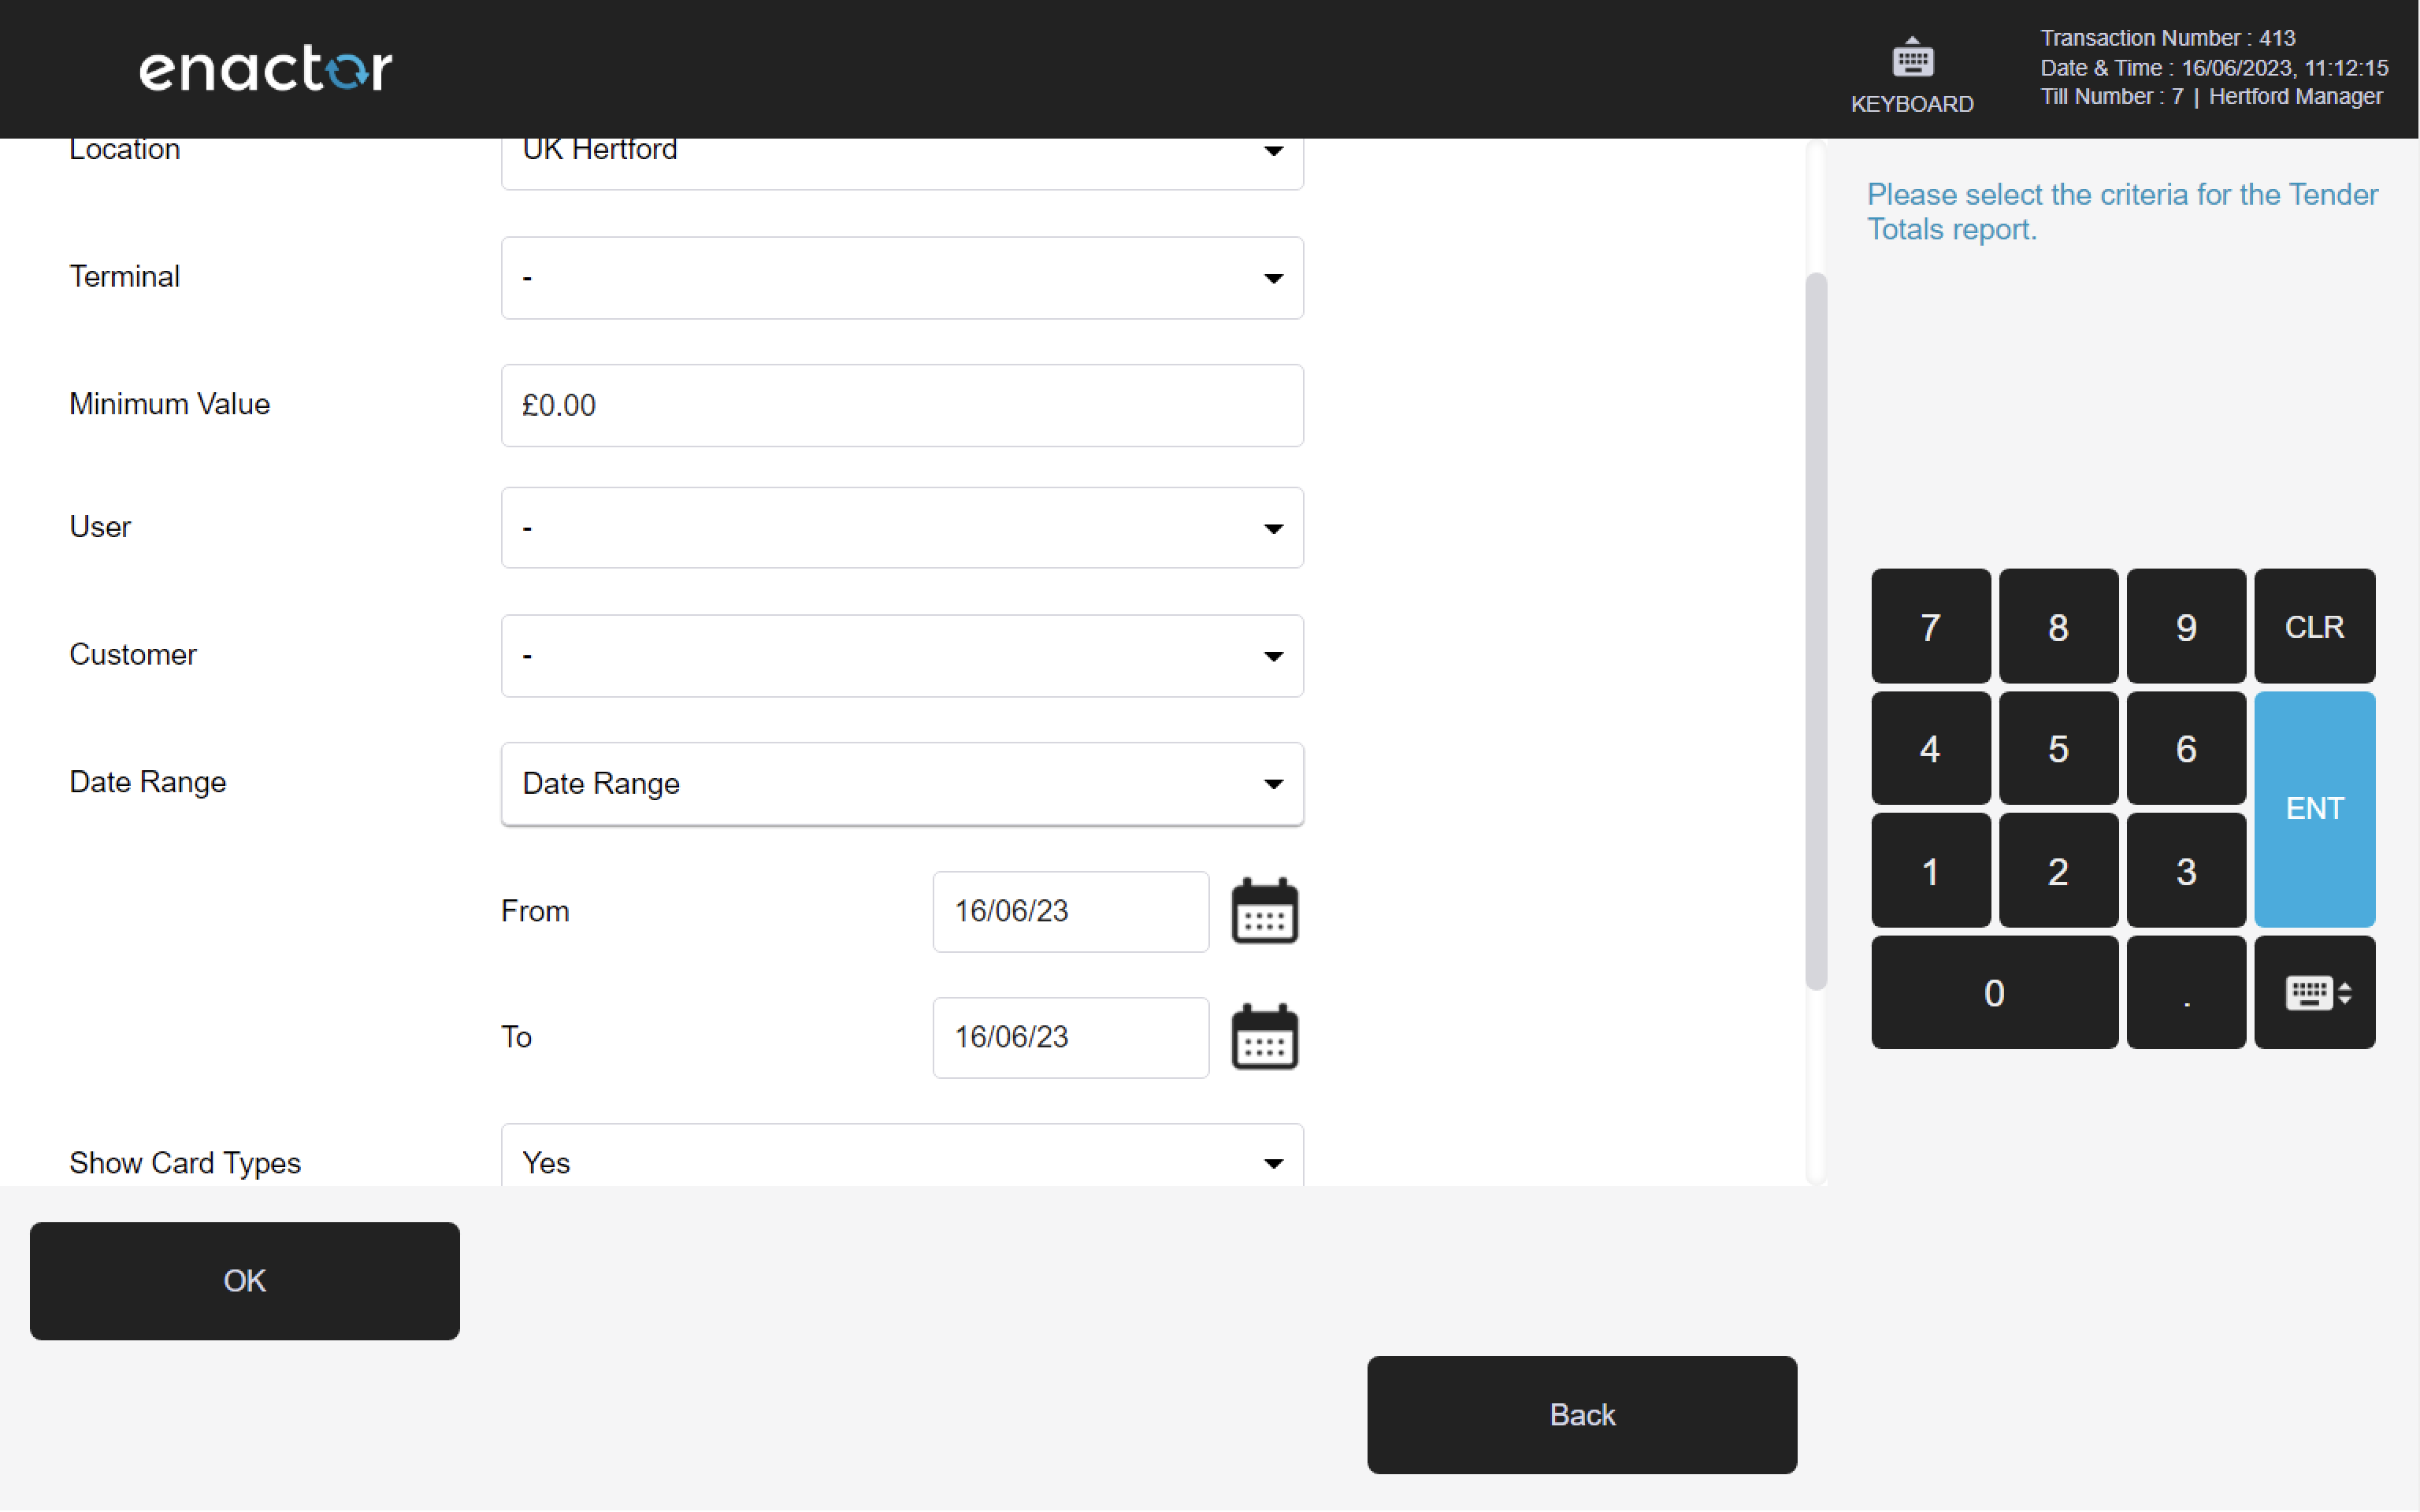
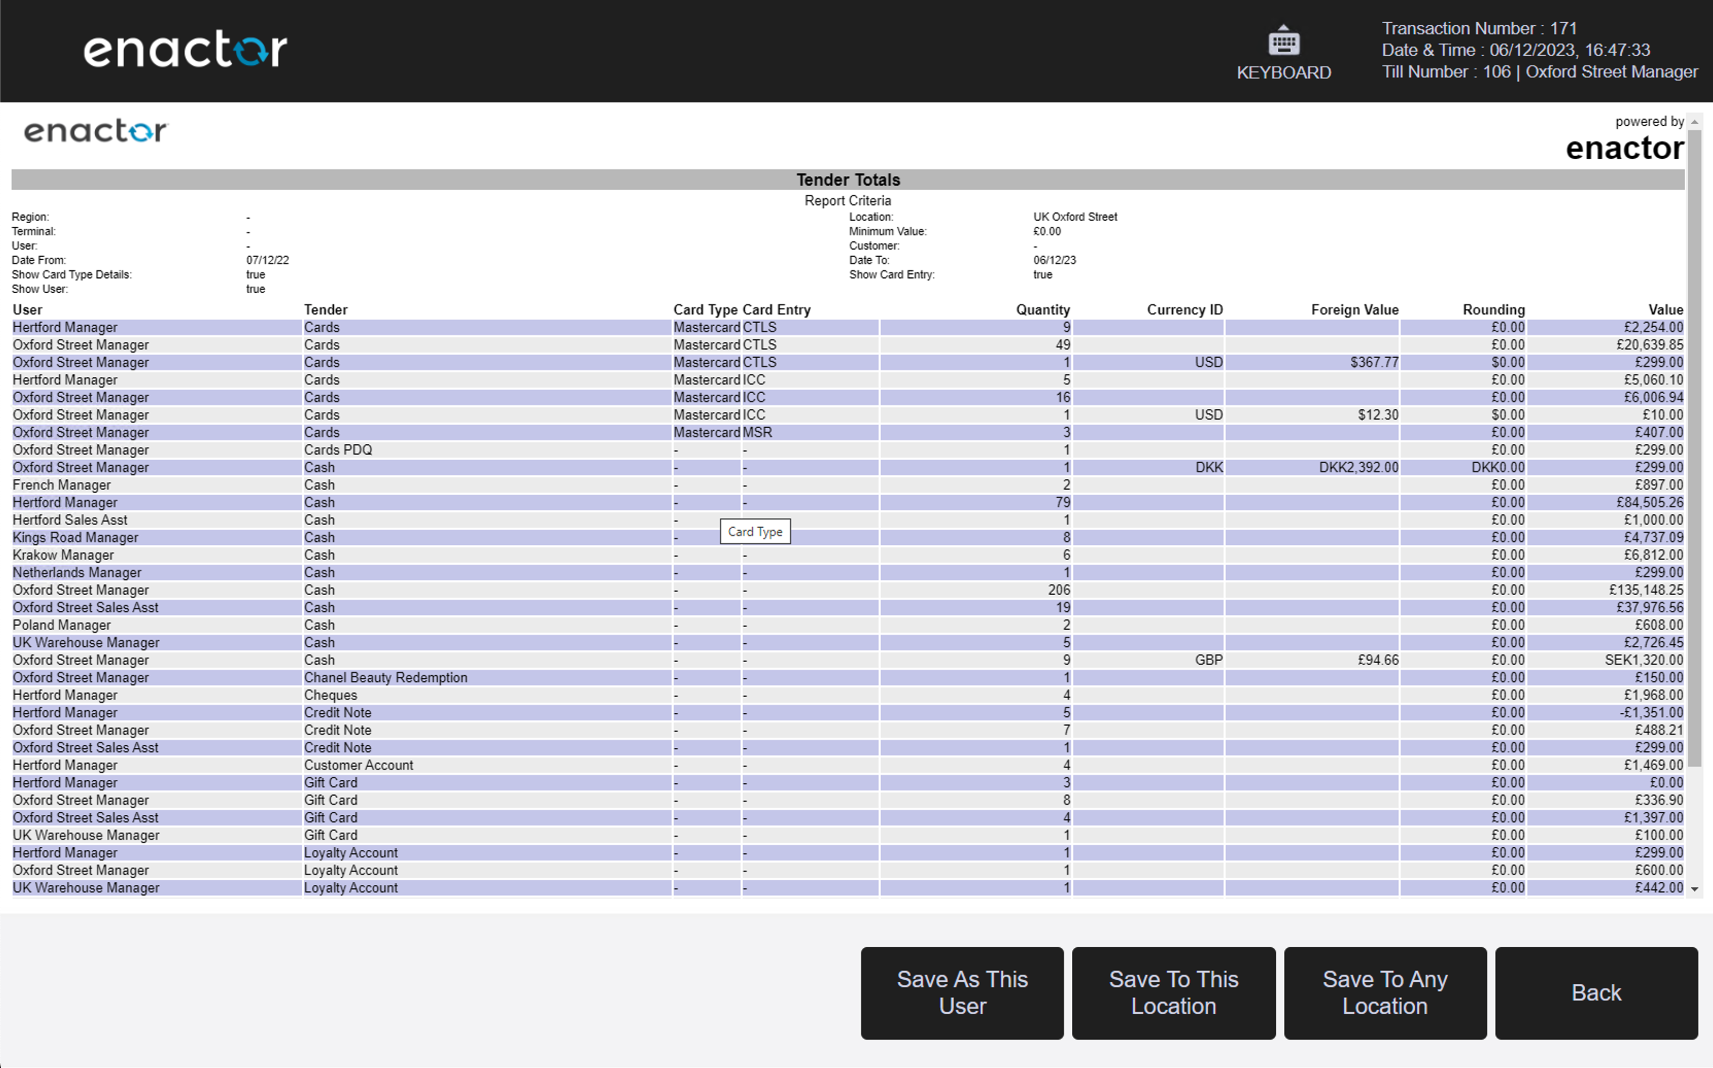
3.1 Tender Totals
Path: Tender Reports > Tender Totals
View tender totals information.
Filter Criteria
| Property | Description |
|---|---|
| Region | Dropdown selection of available regions. |
| Location | Dropdown selection of locations, filtered by the selected region. |
| Terminal | Dropdown selection of terminals, filtered by the selected location. |
| Minimum Value | Numeric input to filter results to tenders above a minimum value. |
| User | Dropdown selection of user. |
| Customer | Dropdown selection of customer. |
| Date Range | Date range selector with from/to date inputs. |
| Show Card Types | Dropdown to control whether card types are displayed in results. |
| Show Card Entry | Dropdown to control whether card entry method is displayed in results. |
| Show User | Dropdown to control whether the user column is displayed in results. |
Output Columns
| Property | Description |
|---|---|
| User | The user who processed the tender. |
| Tender | The tender type used. |
| Card Type | The card type used (if applicable). |
| Card Entry | The method of card entry (if applicable). |
| Quantity | The total number of tender transactions. |
| Currency ID | The currency identifier for the tender. |
| Foreign Value | The value in the foreign currency (if applicable). |
| Rounding | Any rounding applied to the tender value. |
| Value | The total tender value. Grand totals are shown at the bottom. |
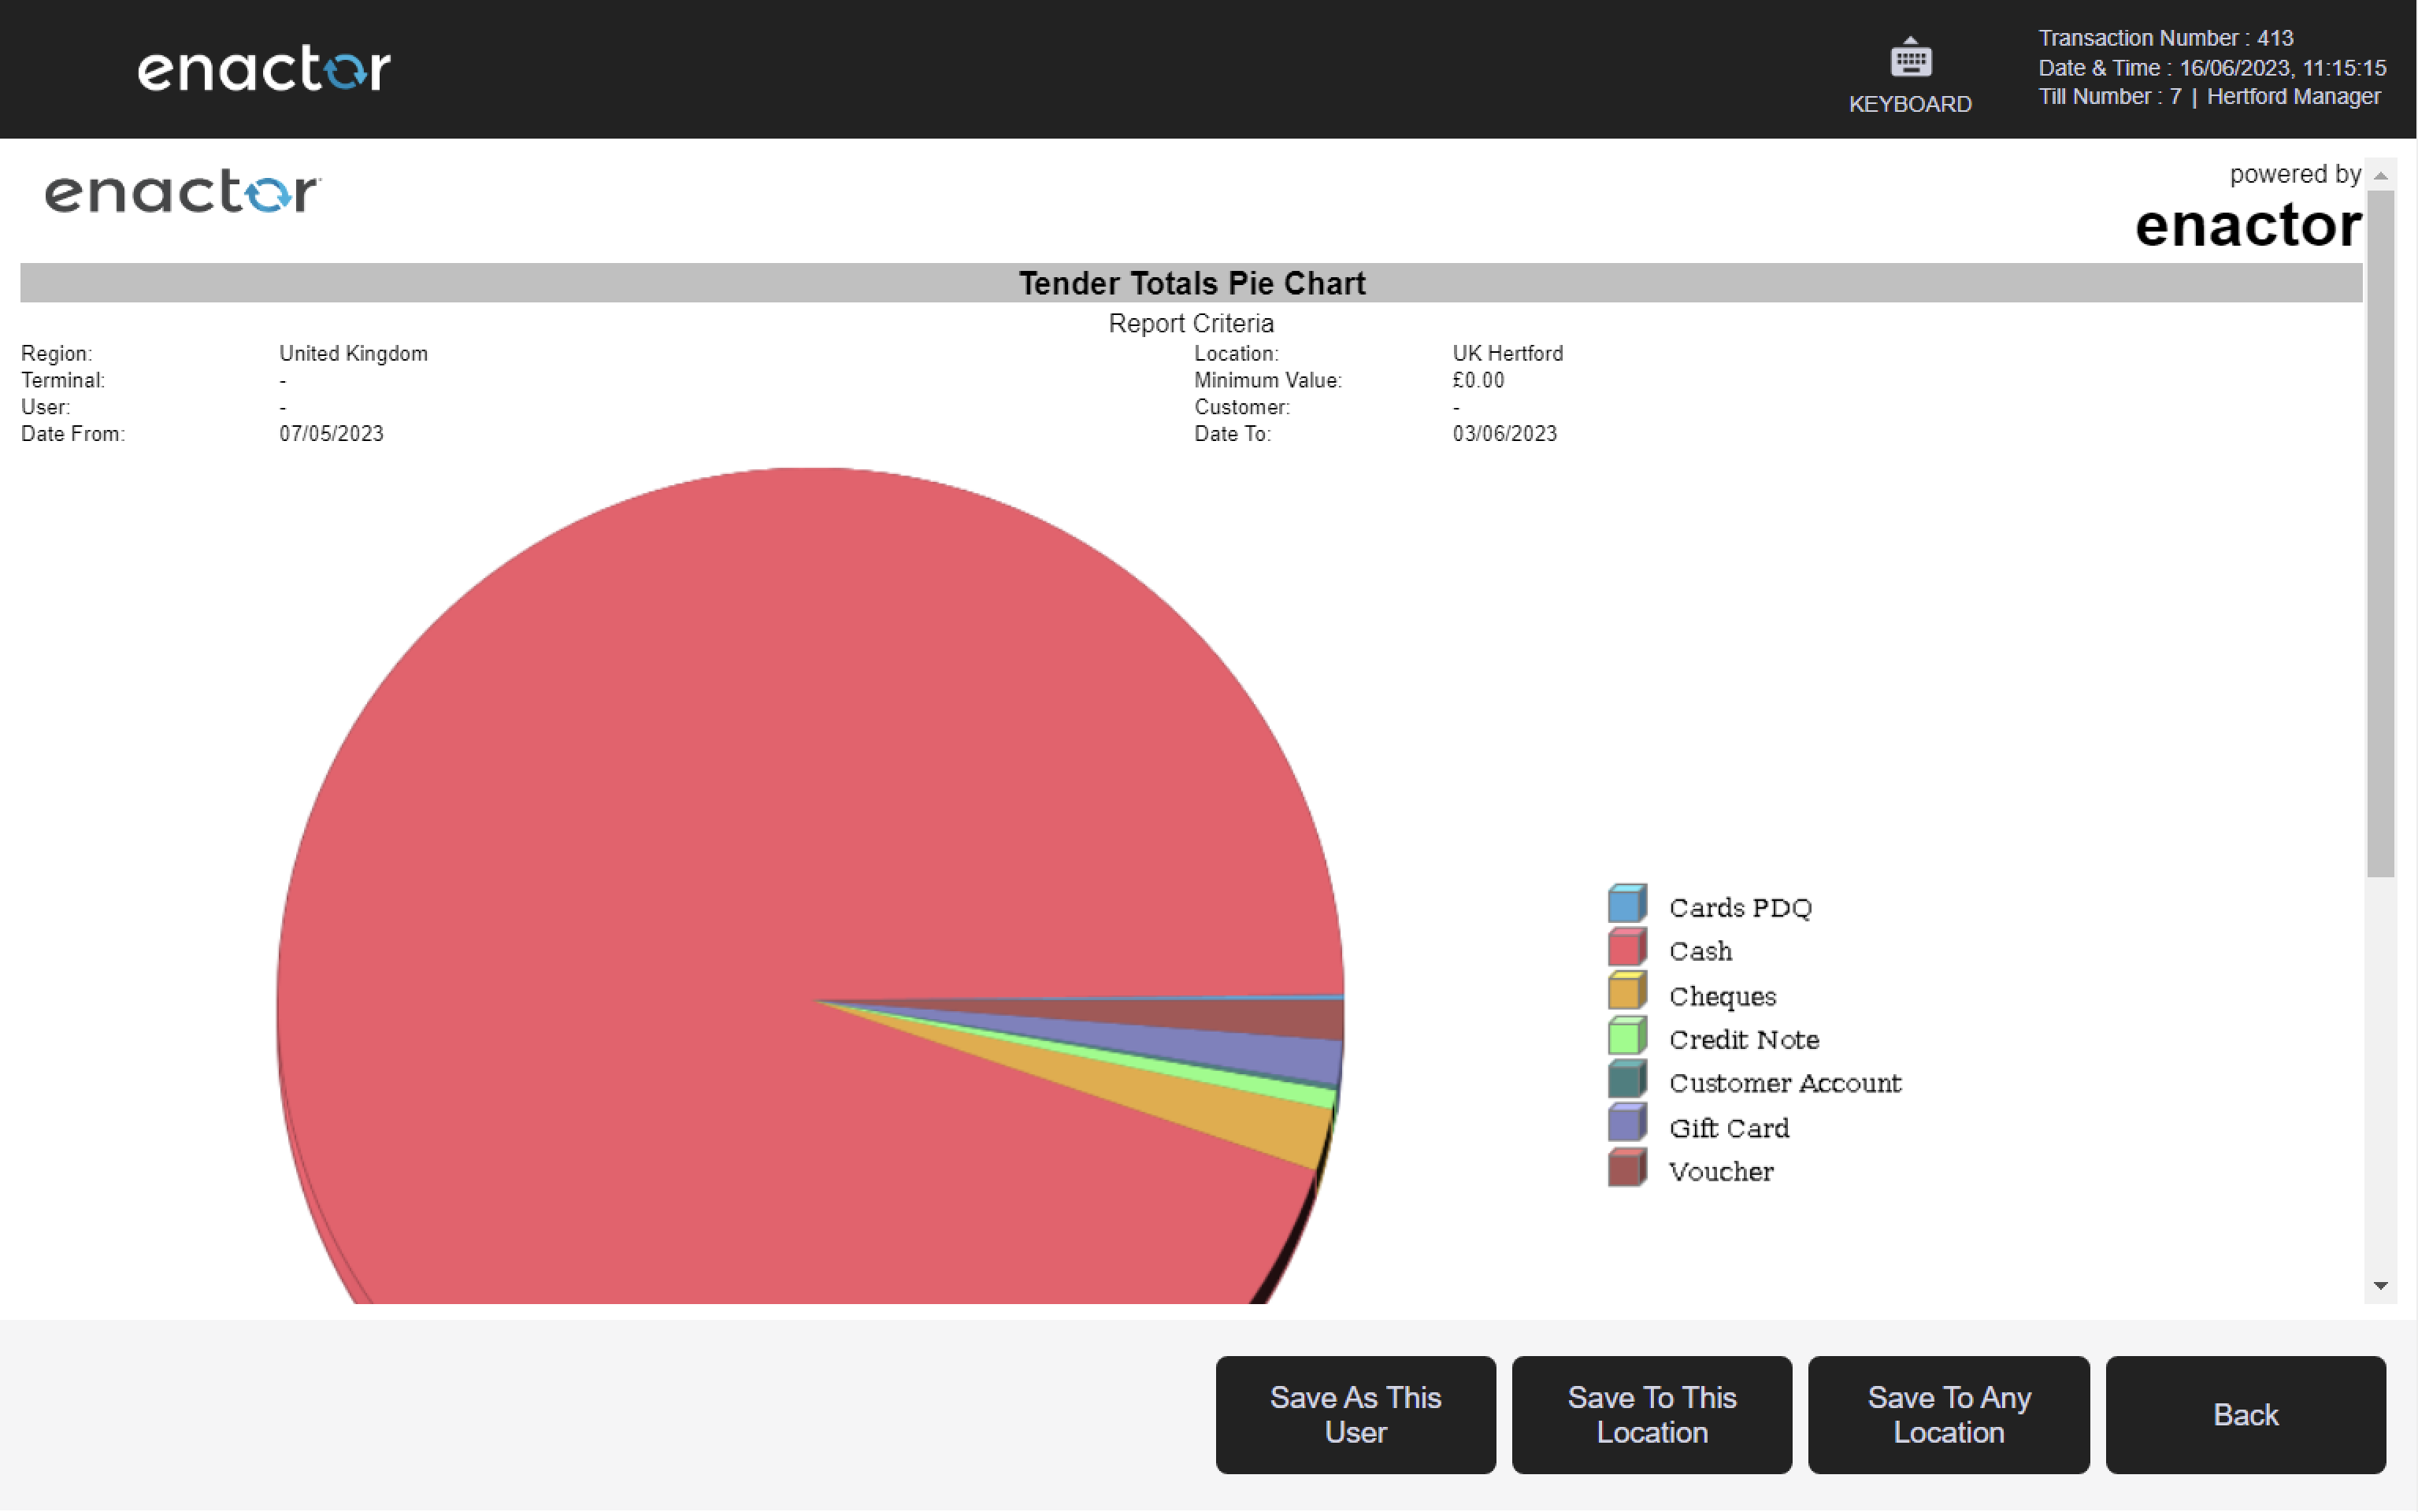
3.2 Tender Totals Pie Chart
Path: Tender Reports > Tender Totals Pie Chart
View tender totals information in pie chart form.
Filter Criteria
| Property | Description |
|---|---|
| Region | Dropdown selection of available regions. |
| Location | Dropdown selection of locations, filtered by the selected region. |
| Terminal | Dropdown selection of terminals, filtered by the selected location. |
| Minimum Value | Numeric input to filter results to tenders above a minimum value. |
| User | Dropdown selection of user. |
| Customer | Dropdown selection of customer. |
| Date Range | Date range selector with from/to date inputs. |

Output Columns
| Property | Description |
|---|---|
| Tender | The tender type, represented as a segment in the pie chart. |
| Quantity | The total number of transactions for the tender type. |
| Value | The total value for the tender type, shown in the pie chart and data table. |
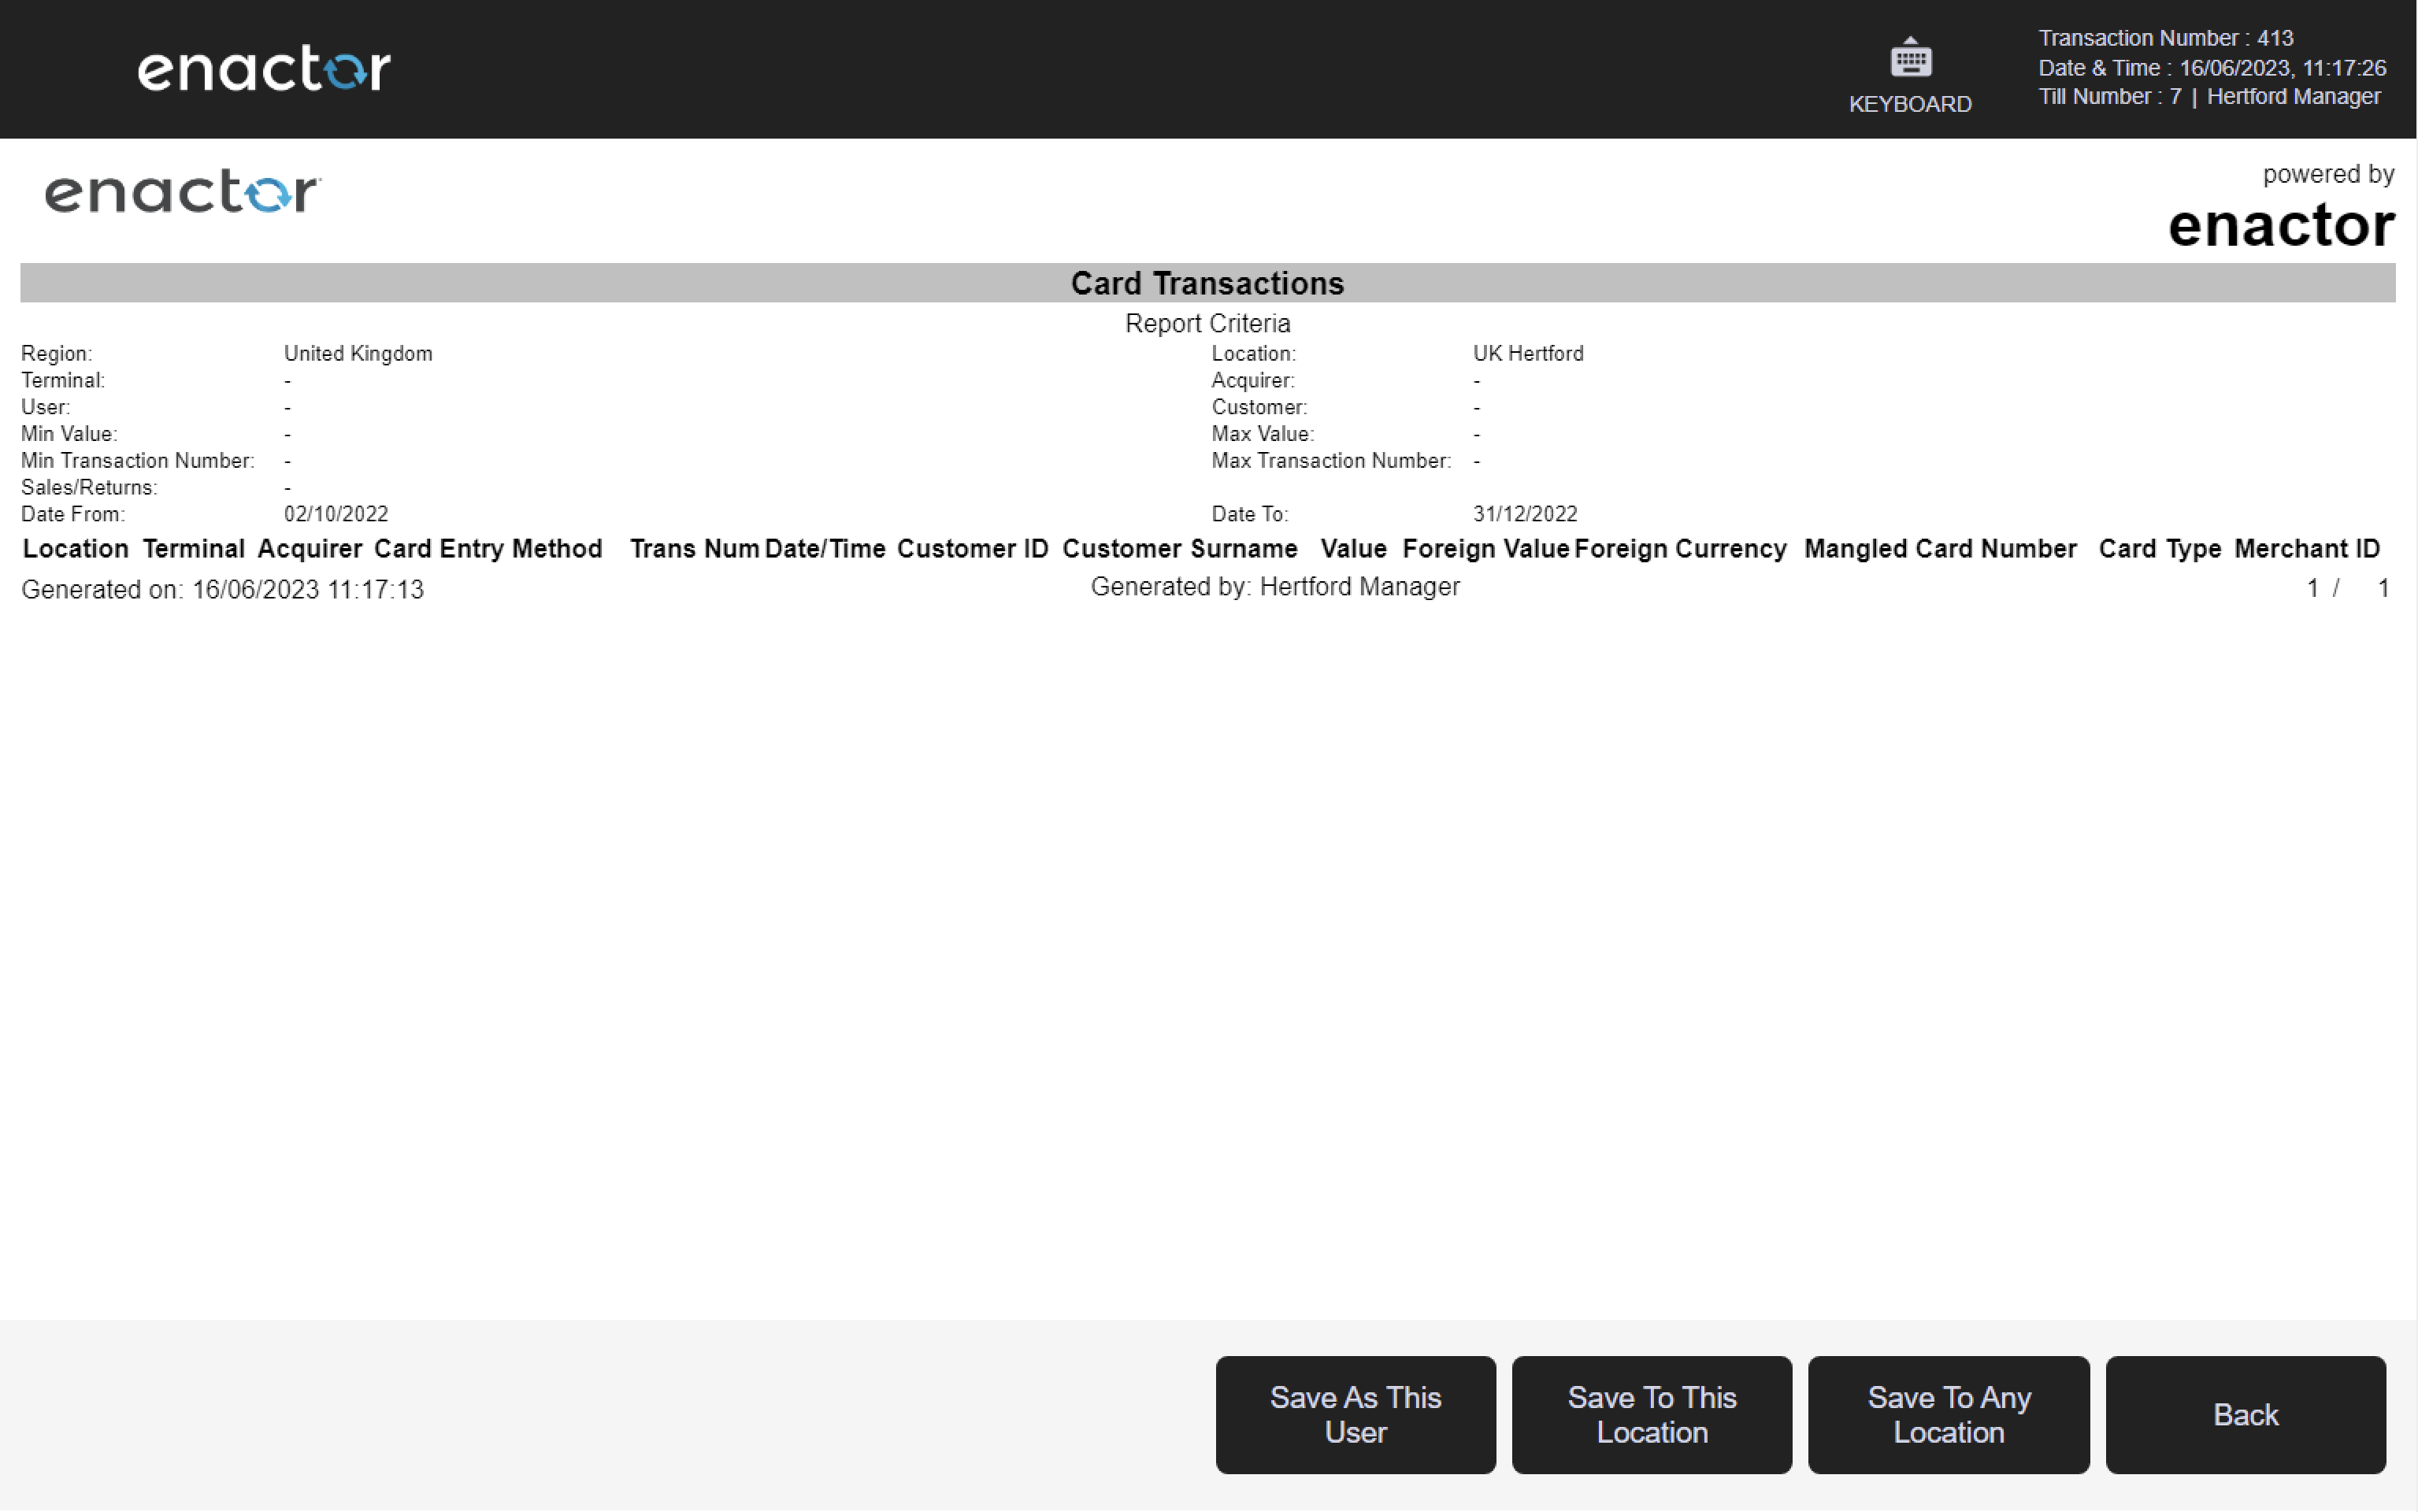
3.3 Card Transactions
Path: Tender Reports > Card Transactions
View card transaction information.
Filter Criteria
| Property | Description |
|---|---|
| View Full Pan | True/False toggle to display the full card PAN number in results. |
| Region | Dropdown selection of available regions. |
| Location | Dropdown selection of locations, filtered by the selected region. |
| Terminal | Dropdown selection of terminals, filtered by the selected location. |
| Acquirer | Dropdown selection of card acquirer. |
| User | Dropdown selection of user. |
| Customer | Dropdown selection of customer. |
| Card Number | Input field for card number search (9-22 digits). |
| Min Card Usage Count | Numeric input for the minimum number of times the card has been used. |
| Min Value | Numeric input for the minimum transaction value. |
| Max Value | Numeric input for the maximum transaction value. |
| Min Transaction Number | Numeric input for the minimum transaction number. |
| Max Transaction Number | Numeric input for the maximum transaction number. |
| Sales/Returns | Dropdown to filter by Sales, Returns, or All transactions. |
| Date Range | Date range selector with from/to date inputs. |

Output Columns
| Property | Description |
|---|---|
| Location | The location where the card transaction was processed. |
| Terminal | The terminal on which the transaction was processed. |
| Acquirer | The card acquirer used for the transaction. |
| Card Entry Method | The method used to enter the card (e.g. chip, swipe, contactless). |
| Trans Num | The transaction number. |
| Date/Time | The date and time of the transaction. |
| Customer ID | The customer identifier (if applicable). |
| Customer Surname | The customer surname (if applicable). |
| Value | The transaction value. |
| Foreign Value | The value in the foreign currency (if applicable). |
| Foreign Currency | The foreign currency code (if applicable). |
| Mangled Card Number | The masked/truncated card number. |
| Card Type | The card type used. |
| Merchant ID | The merchant identifier associated with the transaction. |
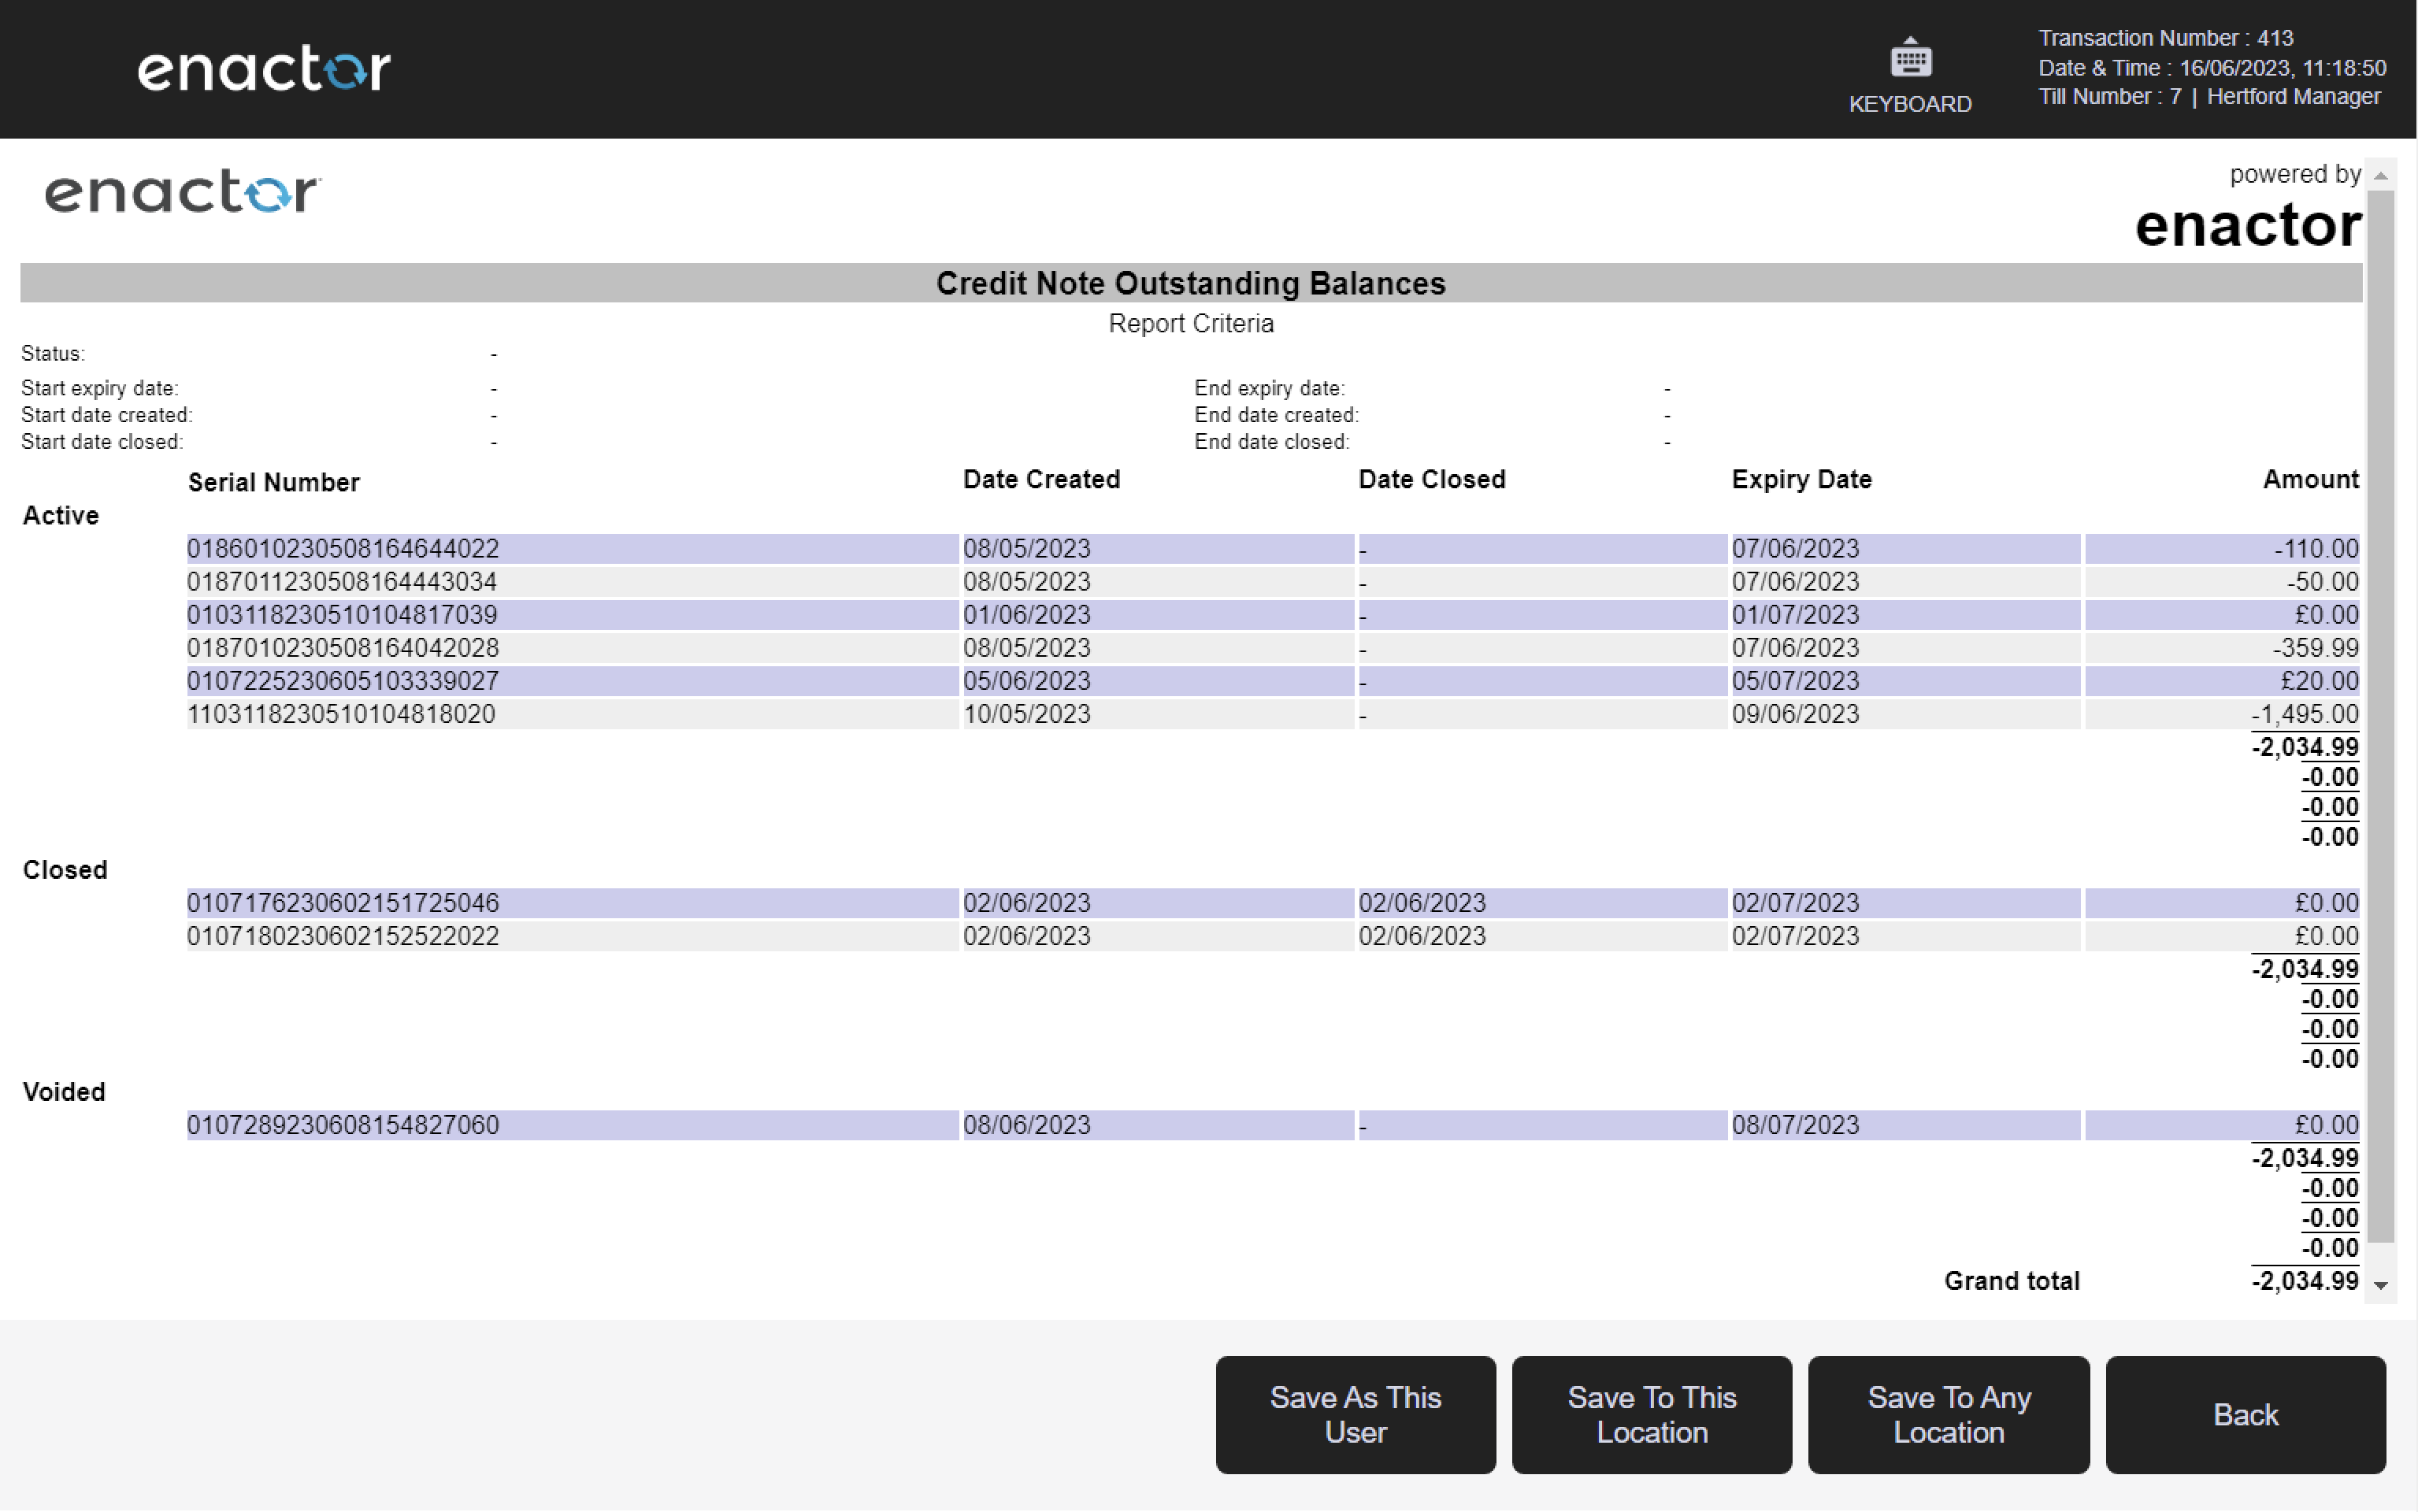
3.4 Credit Note Outstanding Balances
Path: Tender Reports > Credit Note Outstanding Balances
View outstanding credit note balance information.
Filter Criteria
| Property | Description |
|---|---|
| Status | Dropdown selection of credit note status: Active, Expired, Closed, or Voided. |
| Start Expiry Date | Date input for the start of the expiry date range. |
| End Expiry Date | Date input for the end of the expiry date range. |
| Start Date Created | Date input for the start of the creation date range. |
| End Date Created | Date input for the end of the creation date range. |
| Start Date Closed | Date input for the start of the closed date range. |
| End Date Closed | Date input for the end of the closed date range. |

Output Columns
| Property | Description |
|---|---|
| Serial Number | The unique serial number of the credit note. |
| Date Created | The date on which the credit note was created. |
| Date Closed | The date on which the credit note was closed (if applicable). |
| Expiry Date | The expiry date of the credit note. |
| Amount | The outstanding balance of the credit note. |
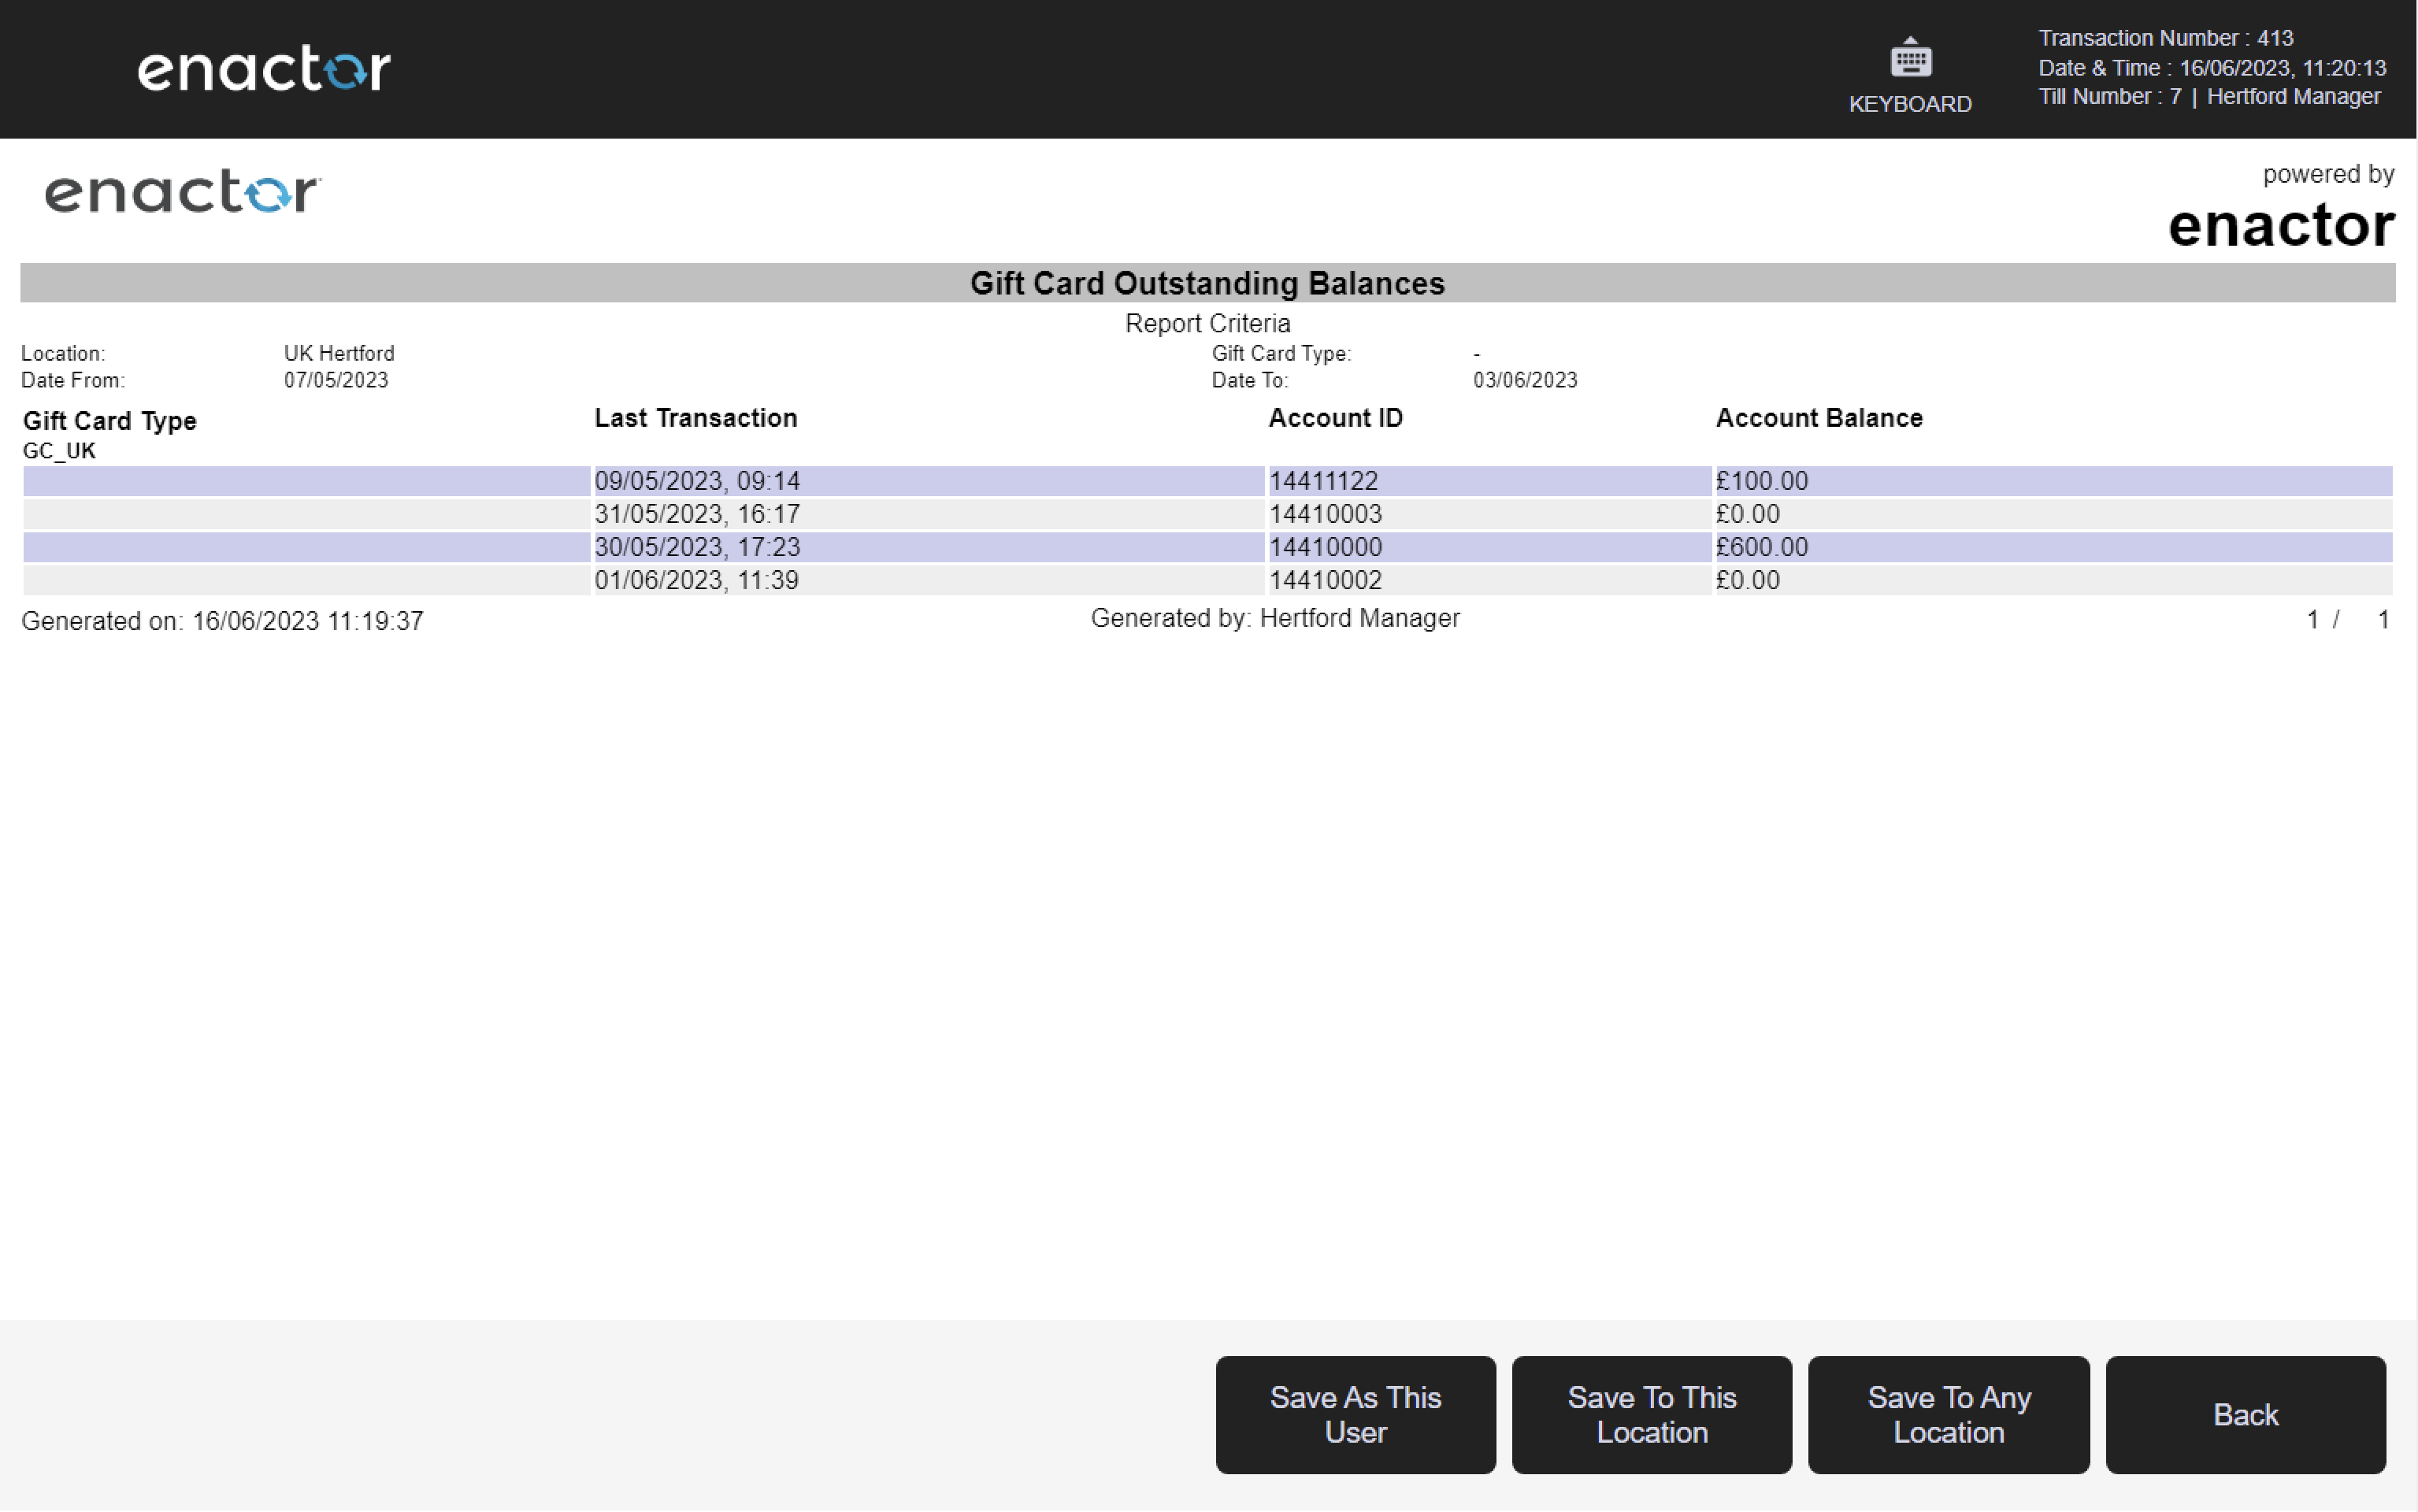
3.5 Gift Card Outstanding Balances
Path: Tender Reports > Gift Card Outstanding Balances
View outstanding gift card balance information.
Filter Criteria
| Property | Description |
|---|---|
| Location | Dropdown selection of available locations. |
| Gift Card Type | Dropdown selection of gift card type. |
| Last Transaction Date | Date range selector for the last transaction date. |

Output Columns
| Property | Description |
|---|---|
| Gift Card Type | The type of gift card. |
| Last Transaction | The date and time of the most recent transaction on the gift card. |
| Account ID | The account identifier associated with the gift card. |
| Account Balance | The current outstanding balance on the gift card. |
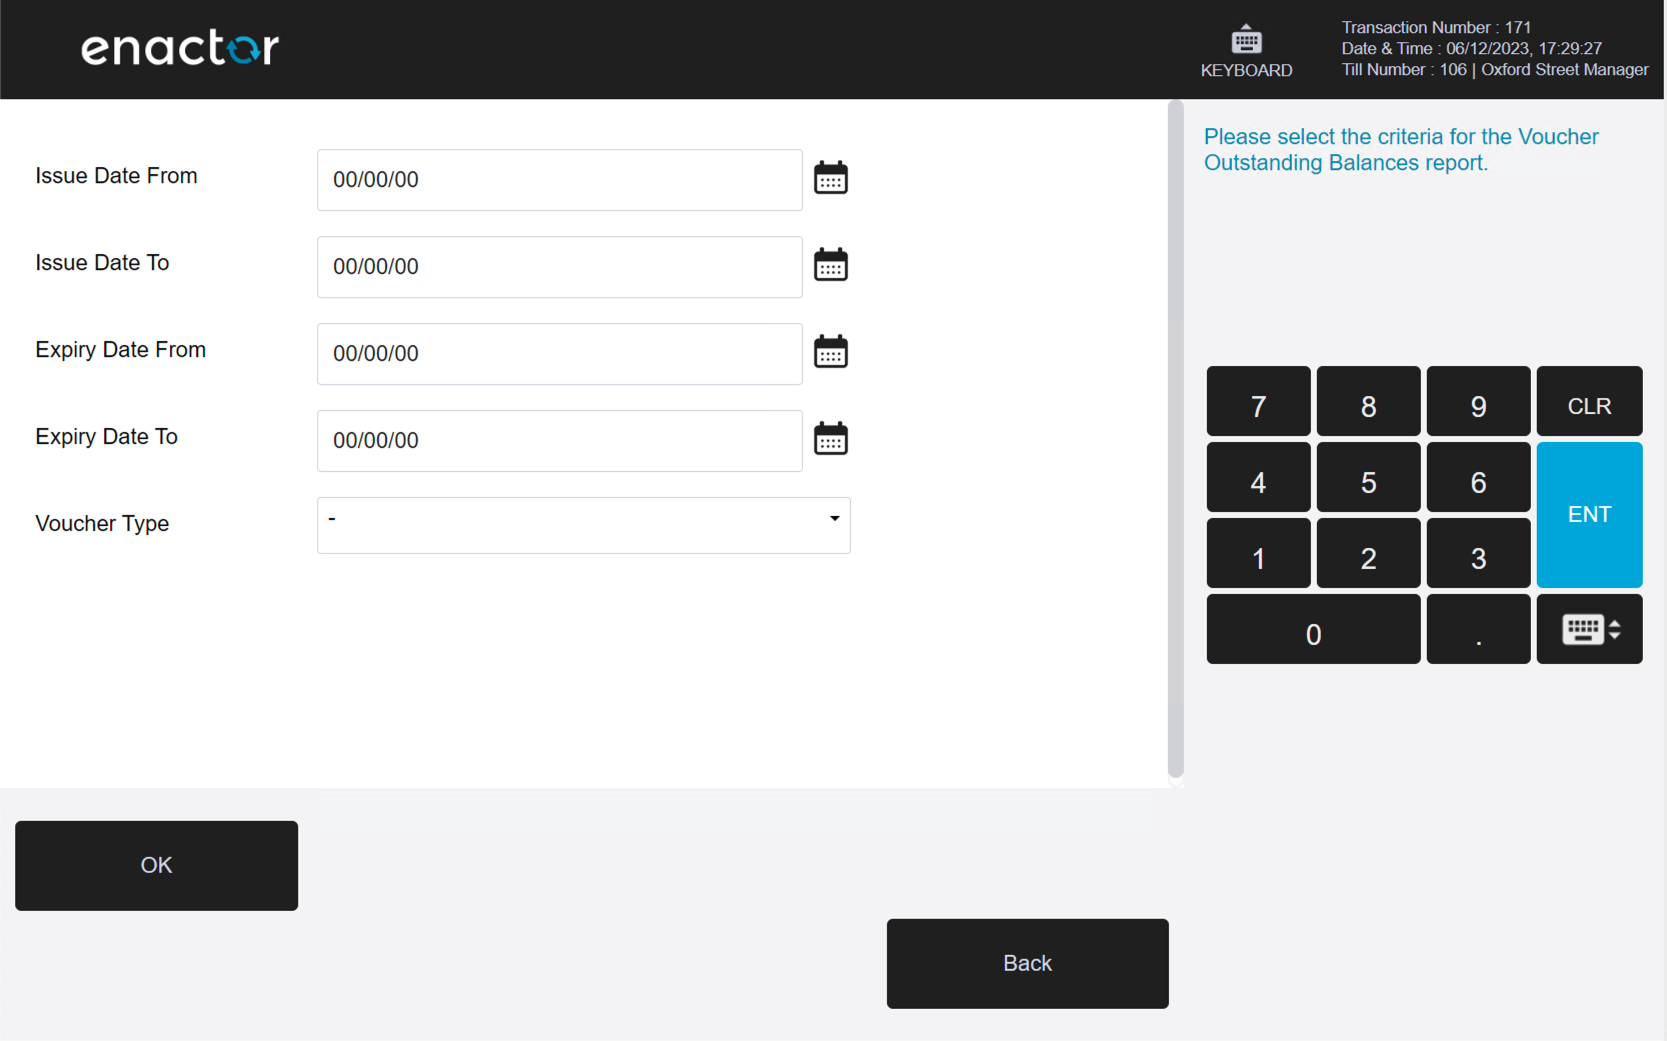
3.6 Voucher Outstanding Balances
Path: Tender Reports > Voucher Outstanding Balances
View outstanding voucher balance information.
Filter Criteria
| Property | Description |
|---|---|
| Issue Date From | Date input for the start of the issue date range (defaults to the current date). |
| Issue Date To | Date input for the end of the issue date range (defaults to the current date). |
| Expiry Date From | Date input for the start of the expiry date range. |
| Expiry Date To | Date input for the end of the expiry date range. |
| Voucher Type | Dropdown selection of voucher type. |
Output Columns
| Property | Description |
|---|---|
| Voucher Type | The type of voucher. |
| Serial Number | The unique serial number of the voucher. |
| Issue Date | The date on which the voucher was issued. |
| Expiry Date | The expiry date of the voucher. |
| Value | The outstanding value of the voucher. |

4 Exception Reports
Path: Web Reports > Exception Reports
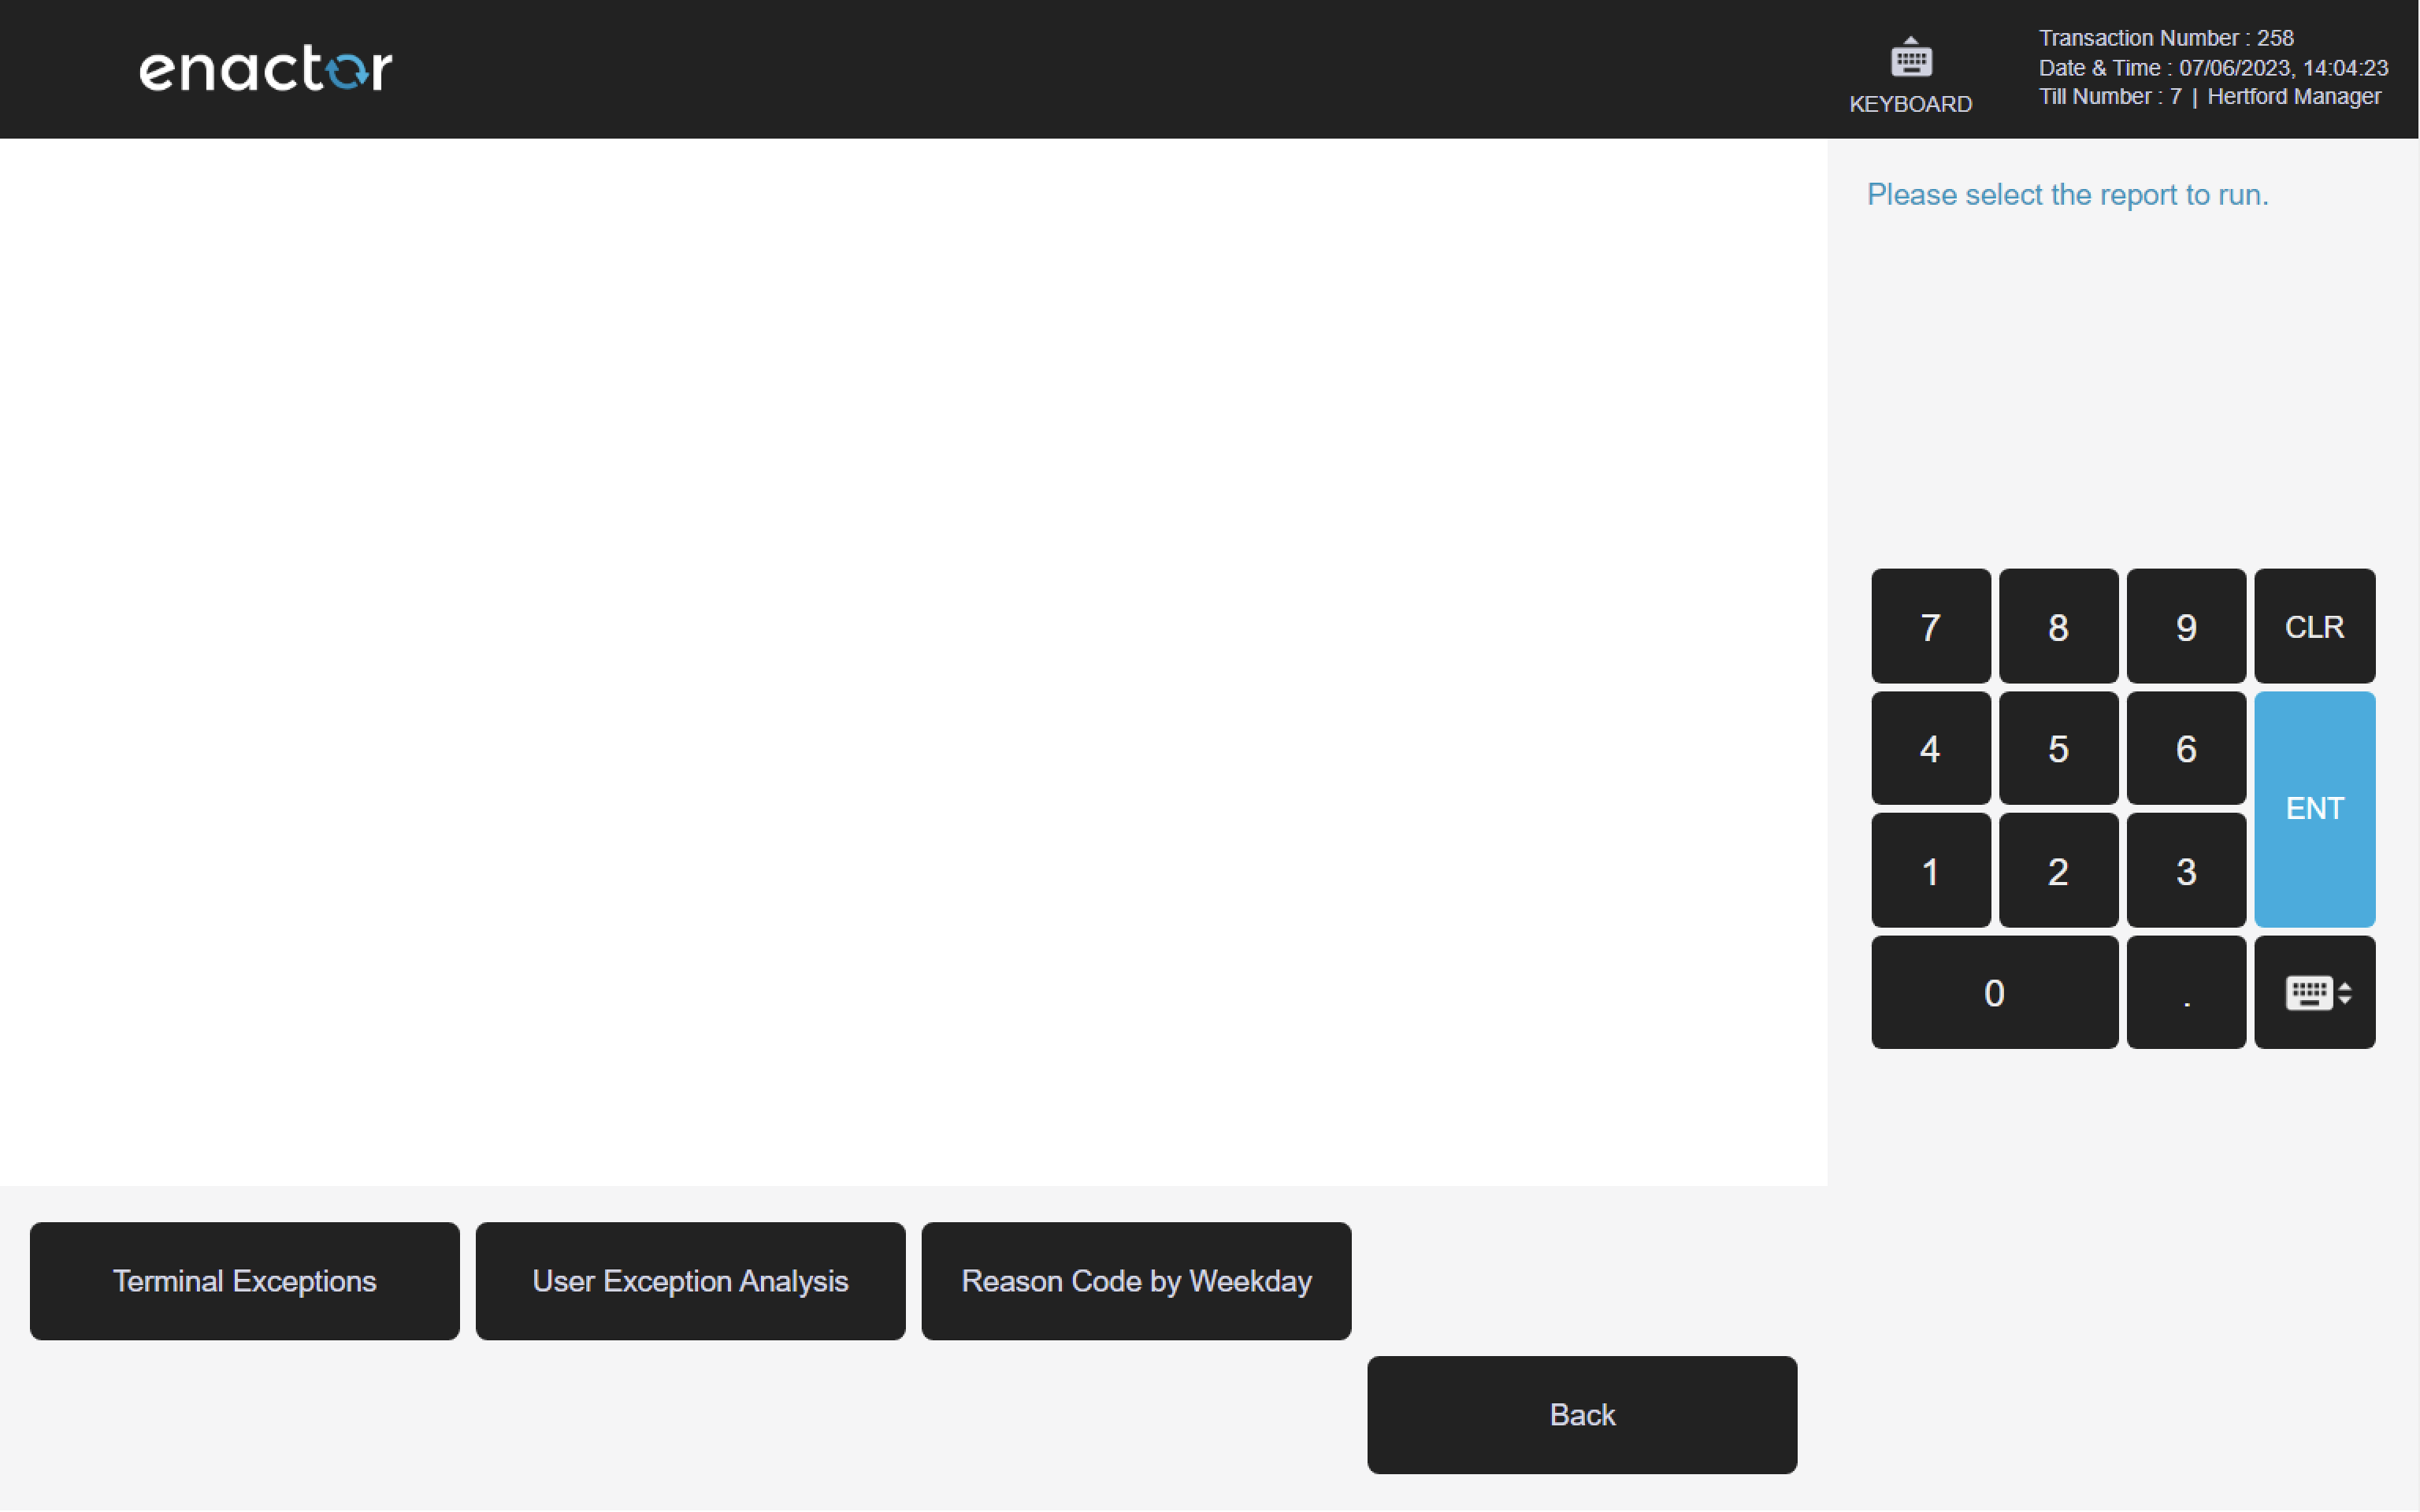
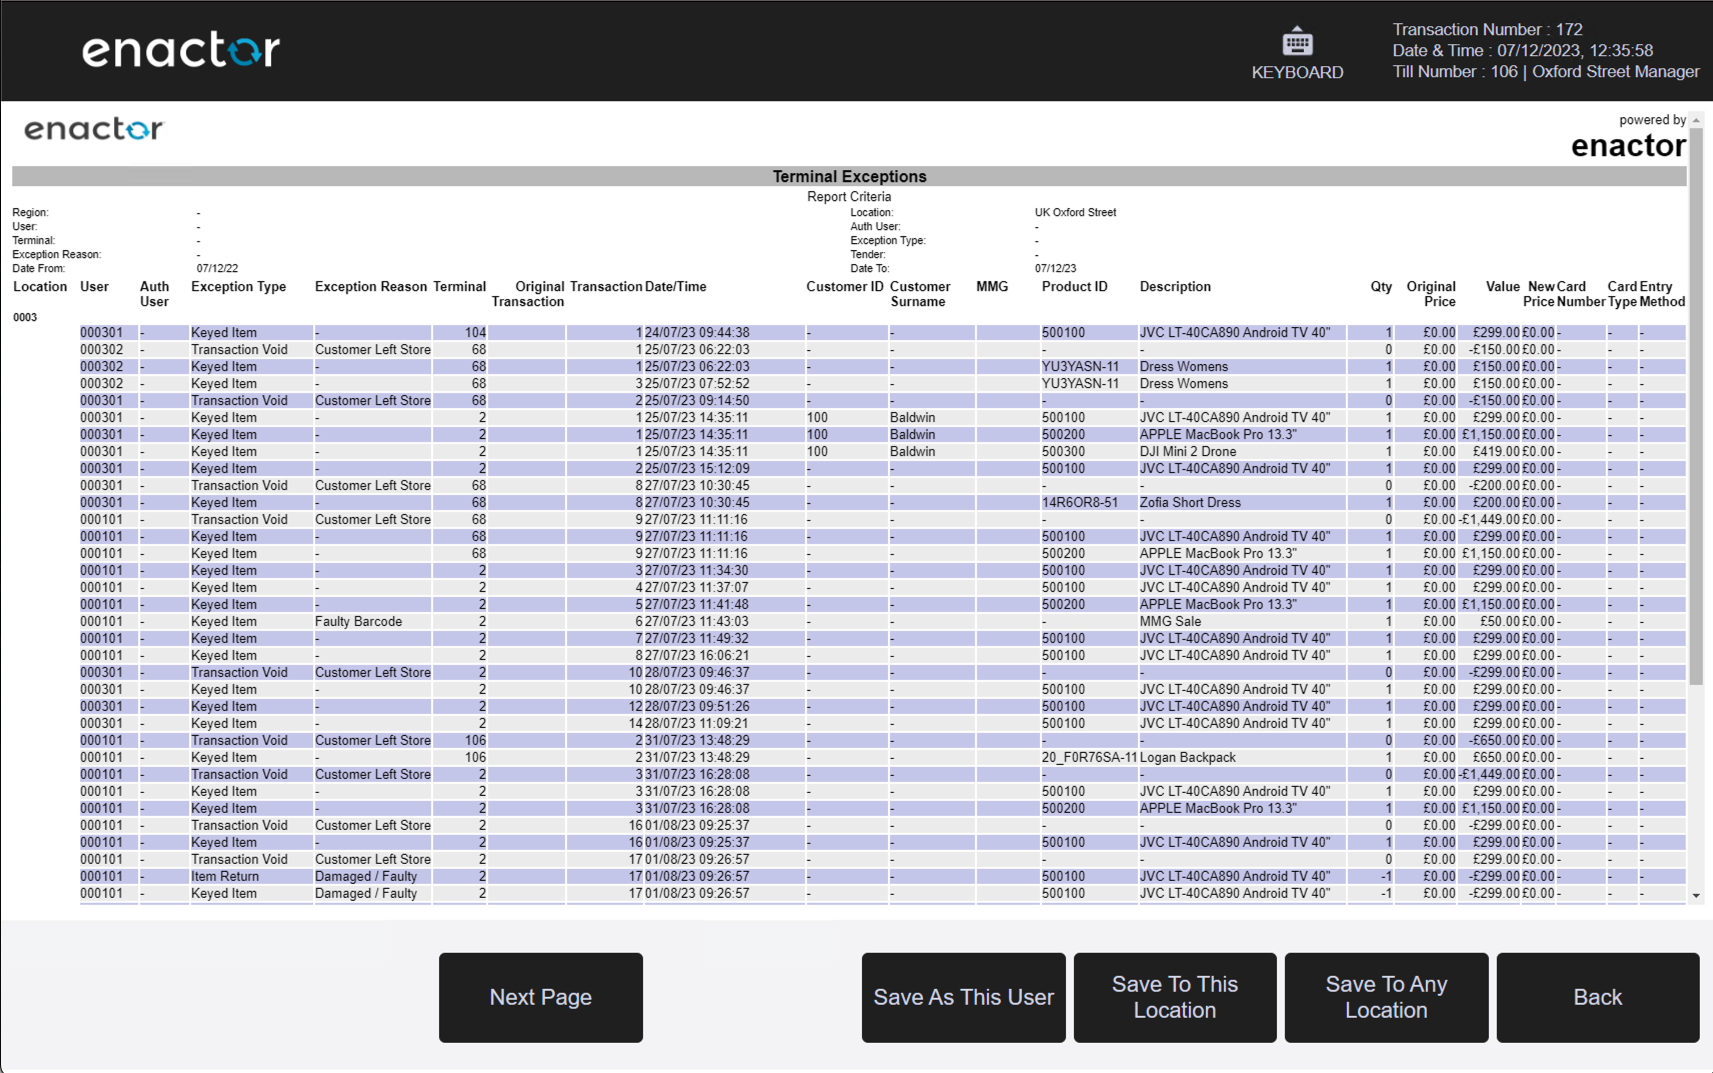
4.1 Terminal Exceptions
Path: Exception Reports > Terminal Exceptions
View terminal exception information.
Filter Criteria
| Property | Description |
|---|---|
| Region | Dropdown selection of available regions. |
| Location | Dropdown selection of locations, filtered by the selected region. |
| Terminal | Dropdown selection of terminals, filtered by the selected location. |
| User | Dropdown selection of user who performed the excepted action. |
| Auth User | Dropdown selection of the authorising user. |
| Exception Type | Multi-selection list of exception types (use Ctrl+click to select multiple). |
| Exception Reason | Dropdown selection of exception reason, filtered by the selected exception type. |
| Tender | Dropdown selection of tender type associated with the exception. |
| Date Range | Date range selector with from/to date inputs. |

Output Columns
| Property | Description |
|---|---|
| Location | The location where the exception occurred. |
| User | The user who performed the excepted action. |
| Auth User | The user who authorised the exception. |
| Exception Type | The type of exception. |
| Exception Reason | The reason code associated with the exception. |
| Terminal | The terminal on which the exception occurred. |
| Original Transaction | The original transaction number (where applicable). |
| Transaction | The transaction number of the exception event. |
| Date/Time | The date and time of the exception. |
| Customer ID | The customer identifier (if applicable). |
| Customer Surname | The customer surname (if applicable). |
| MMG | The merchandise management group associated with the excepted item. |
| Product ID | The unique identifier of the product associated with the exception. |
| Description | The product description. |
| Qty | The quantity involved in the exception. |
| Original Price | The original price of the item before the exception. |
| Value | The value associated with the exception. |
| New Price | The new price applied as a result of the exception (if applicable). |
| Card Number | The masked card number (if applicable). |
| Card Type | The card type (if applicable). |
| Entry Method | The card entry method (if applicable). |
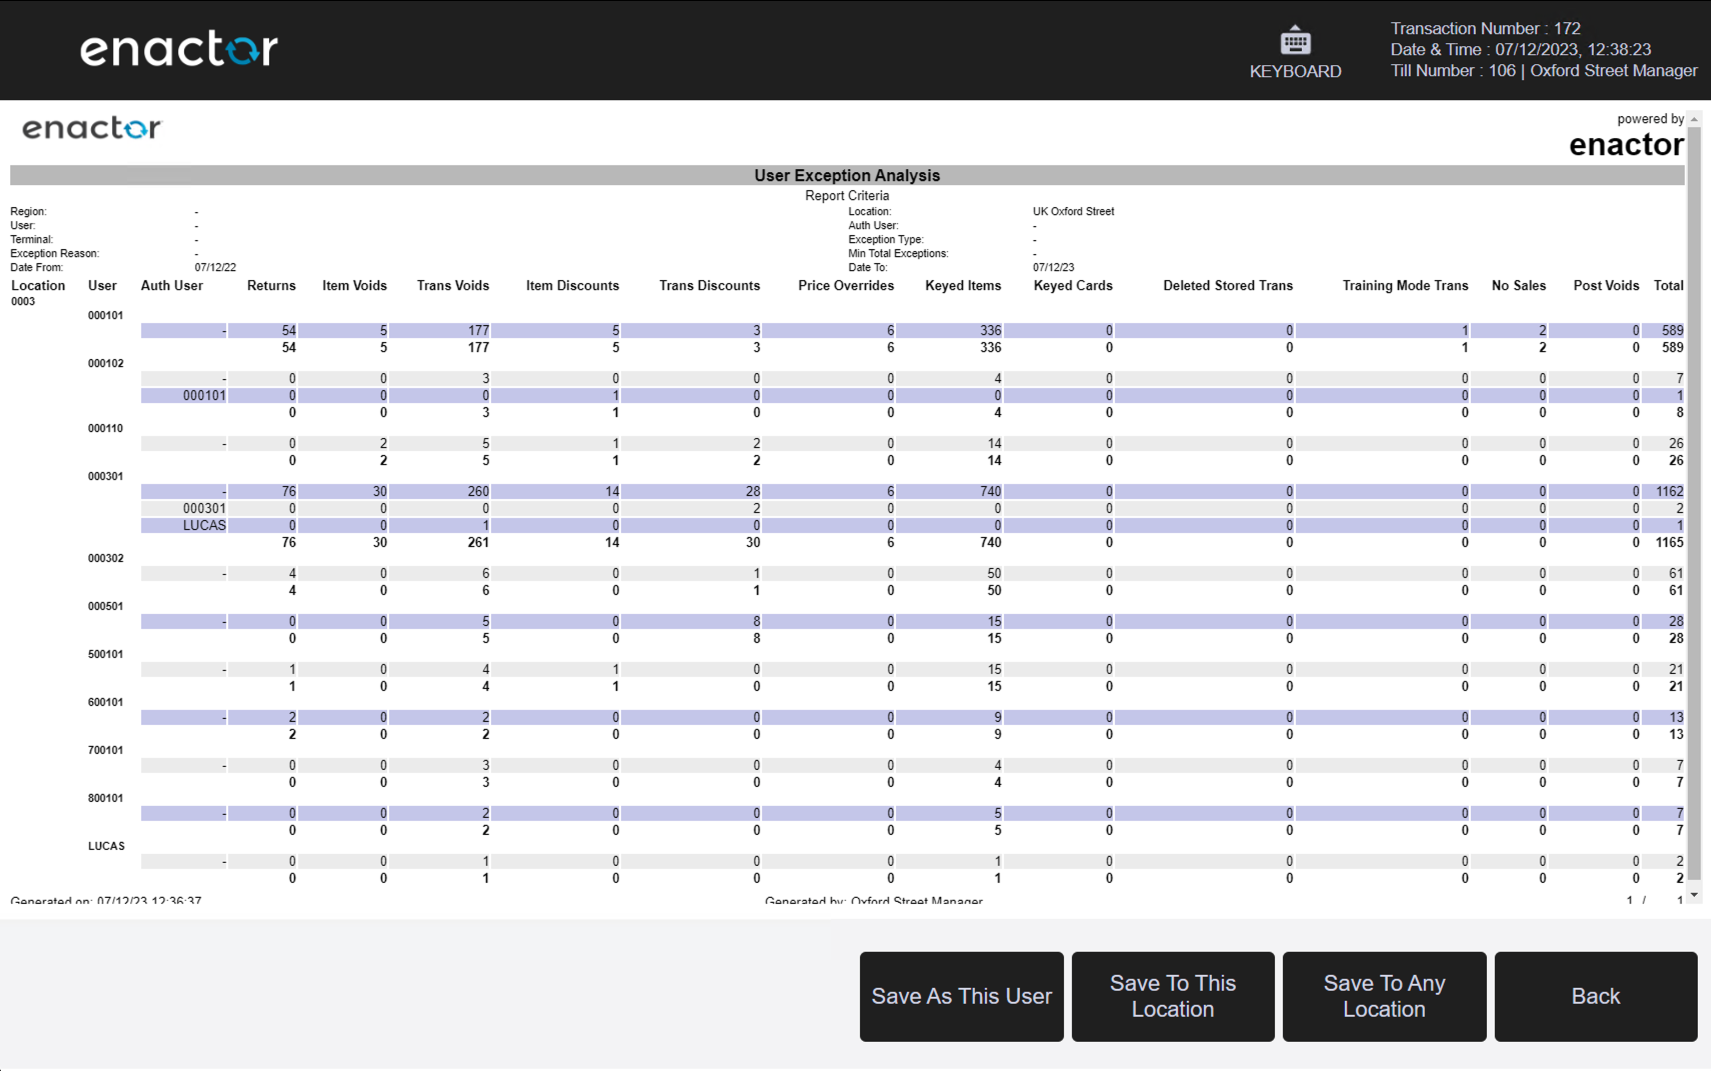
4.2 User Exception Analysis
Path: Exception Reports > User Exception Analysis
View user exception analysis information.
Filter Criteria
| Property | Description |
|---|---|
| Region | Dropdown selection of available regions. |
| Location | Dropdown selection of locations, filtered by the selected region. |
| Terminal | Dropdown selection of terminals, filtered by the selected location. |
| User | Dropdown selection of user. |
| Auth User | Dropdown selection of the authorising user. |
| Exception Type | Multi-selection list of exception types (use Ctrl+click to select multiple). |
| Exception Reason | Dropdown selection of exception reason, filtered by the selected exception type. |
| Min Total Exceptions | Numeric input for the minimum total number of exceptions to include in results. |
| Date Range | Date range selector with from/to date inputs. |

Output Columns
| Property | Description |
|---|---|
| Location | The location associated with the user's exceptions. |
| User | The user identifier. |
| Auth User | The authorising user identifier. |
| Returns | The number of return exceptions for the user. |
| Item Voids | The number of item void exceptions for the user. |
| Trans Voids | The number of transaction void exceptions for the user. |
| Item Discounts | The number of item discount exceptions for the user. |
| Trans Discounts | The number of transaction discount exceptions for the user. |
| Price Overrides | The number of price override exceptions for the user. |
| Keyed Items | The number of keyed item exceptions for the user. |
| Keyed Cards | The number of keyed card exceptions for the user. |
| Deleted Stored Trans | The number of deleted stored transaction exceptions for the user. |
| Training Mode Trans | The number of training mode transaction exceptions for the user. |
| No Sales | The number of no sale exceptions for the user. |
| Post Voids | The number of post void exceptions for the user. |
| Total | The total number of exceptions across all types for the user. |
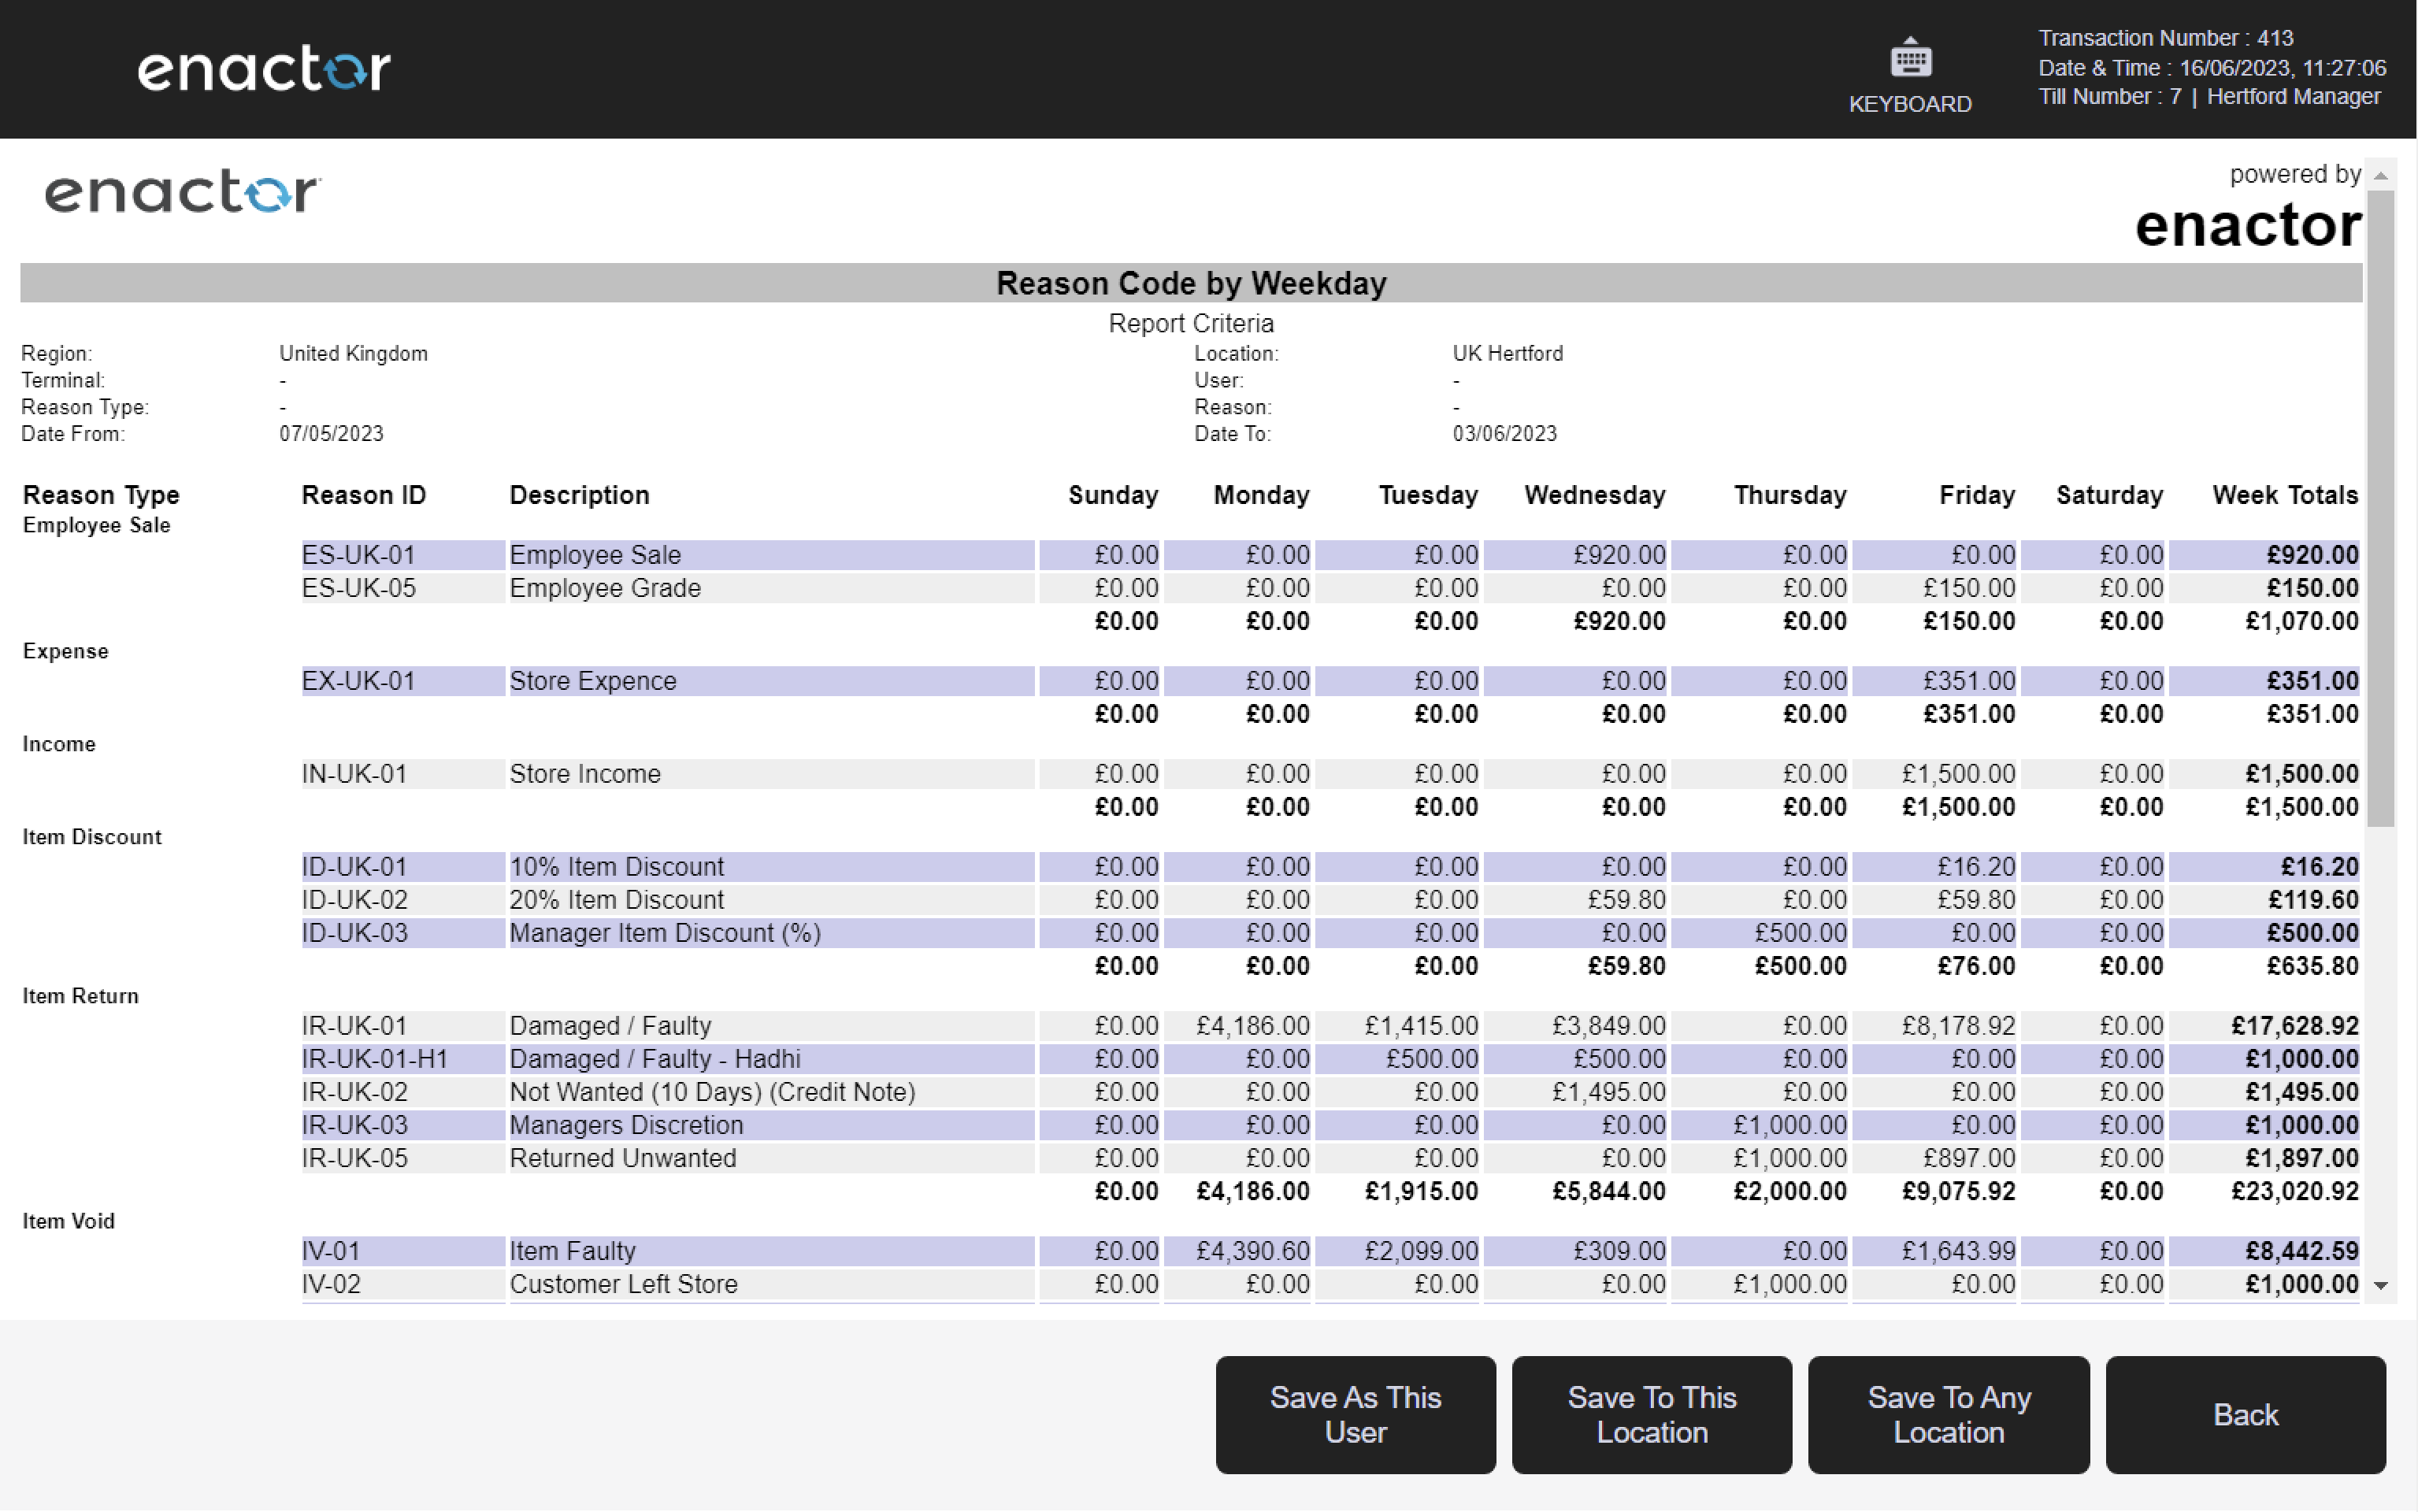
4.3 Reason Code by Weekday
Path: Exception Reports > Reason Code by Weekday
View reason code usage by weekday. The results table presents a column for each day of the week.
Filter Criteria
| Property | Description |
|---|---|
| Region | Dropdown selection of available regions. |
| Location | Dropdown selection of locations, filtered by the selected region. |
| Terminal | Dropdown selection of terminals, filtered by the selected location. |
| User | Dropdown selection of user. |
| Reason Type | Dropdown selection of reason type. |
| Reason | Dropdown selection of reason, filtered by the selected reason type. |
| Date Range | Date range selector with from/to date inputs. |

Output Columns
| Property | Description |
|---|---|
| Reason Type | The type of reason code. |
| Reason ID | The unique identifier of the reason code. |
| Description | The description of the reason code. |
| Monday - Sunday | A column for each day of the week, showing the count of times the reason code was used on that day. |
| Daily Totals | The total count of reason code usages per day across all reason codes. |
| Weekly Total | The total count of reason code usages across the entire selected period. |
5 Employee Reports
Path: Web Reports > Employee Reports
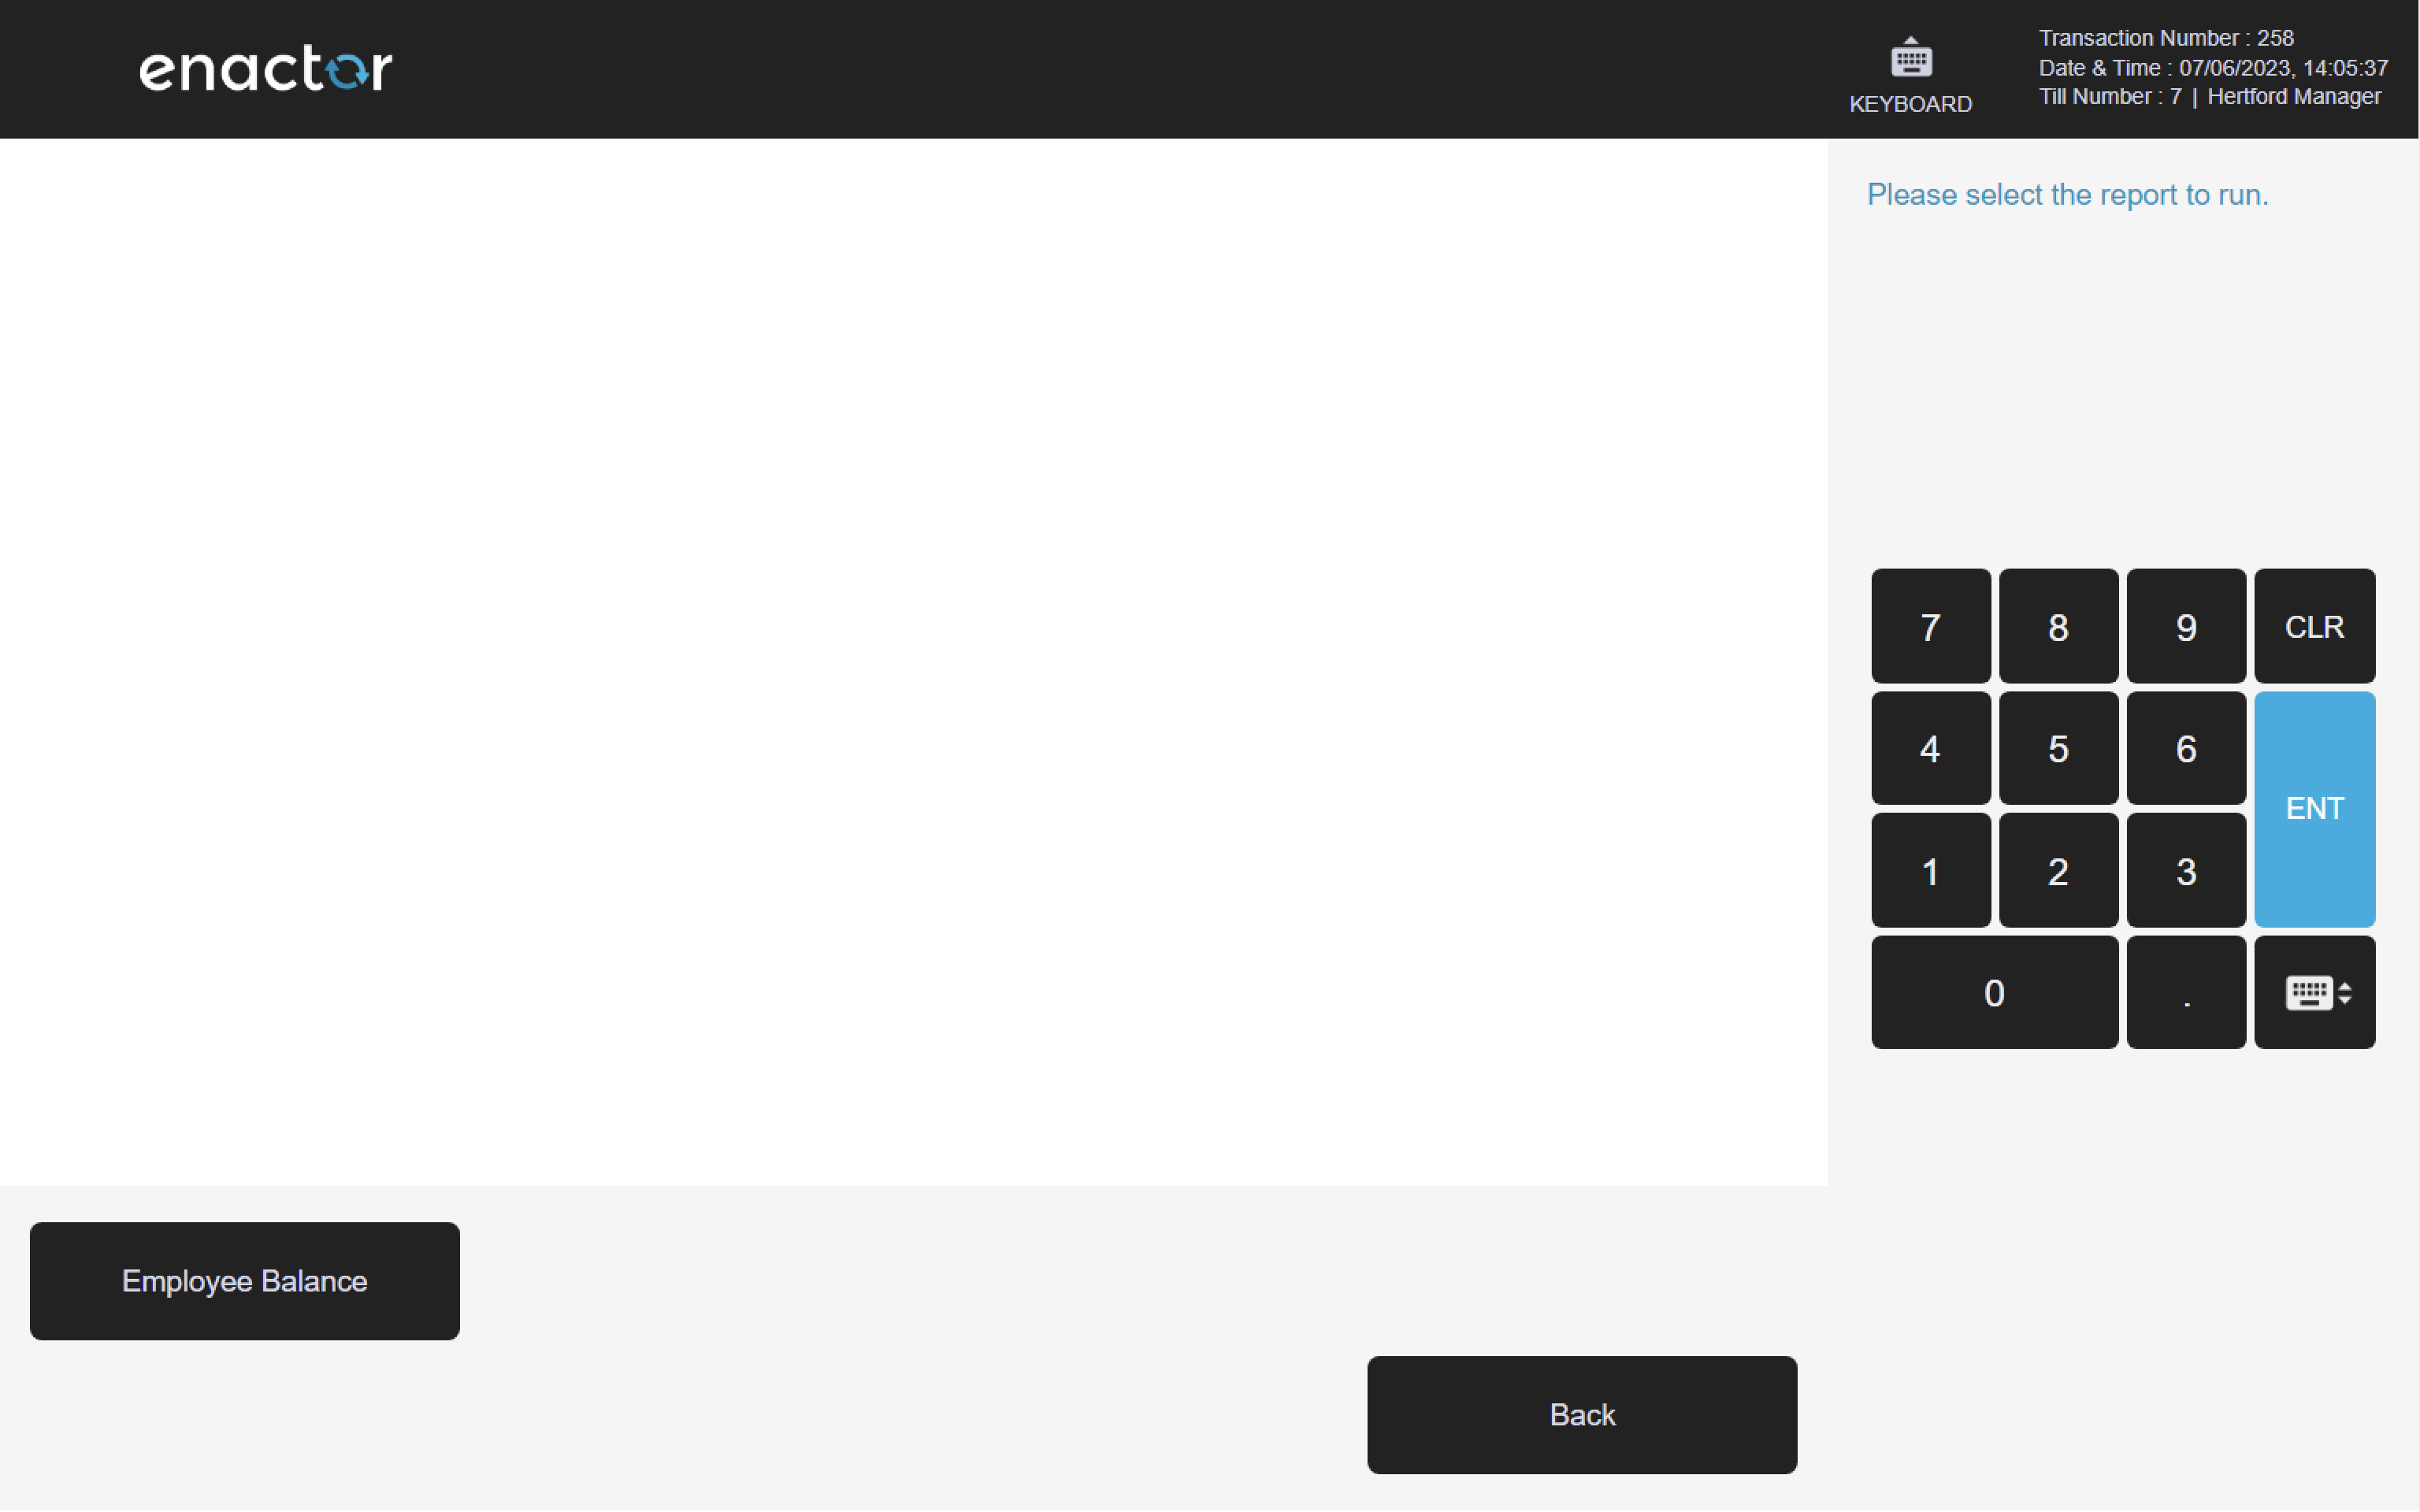
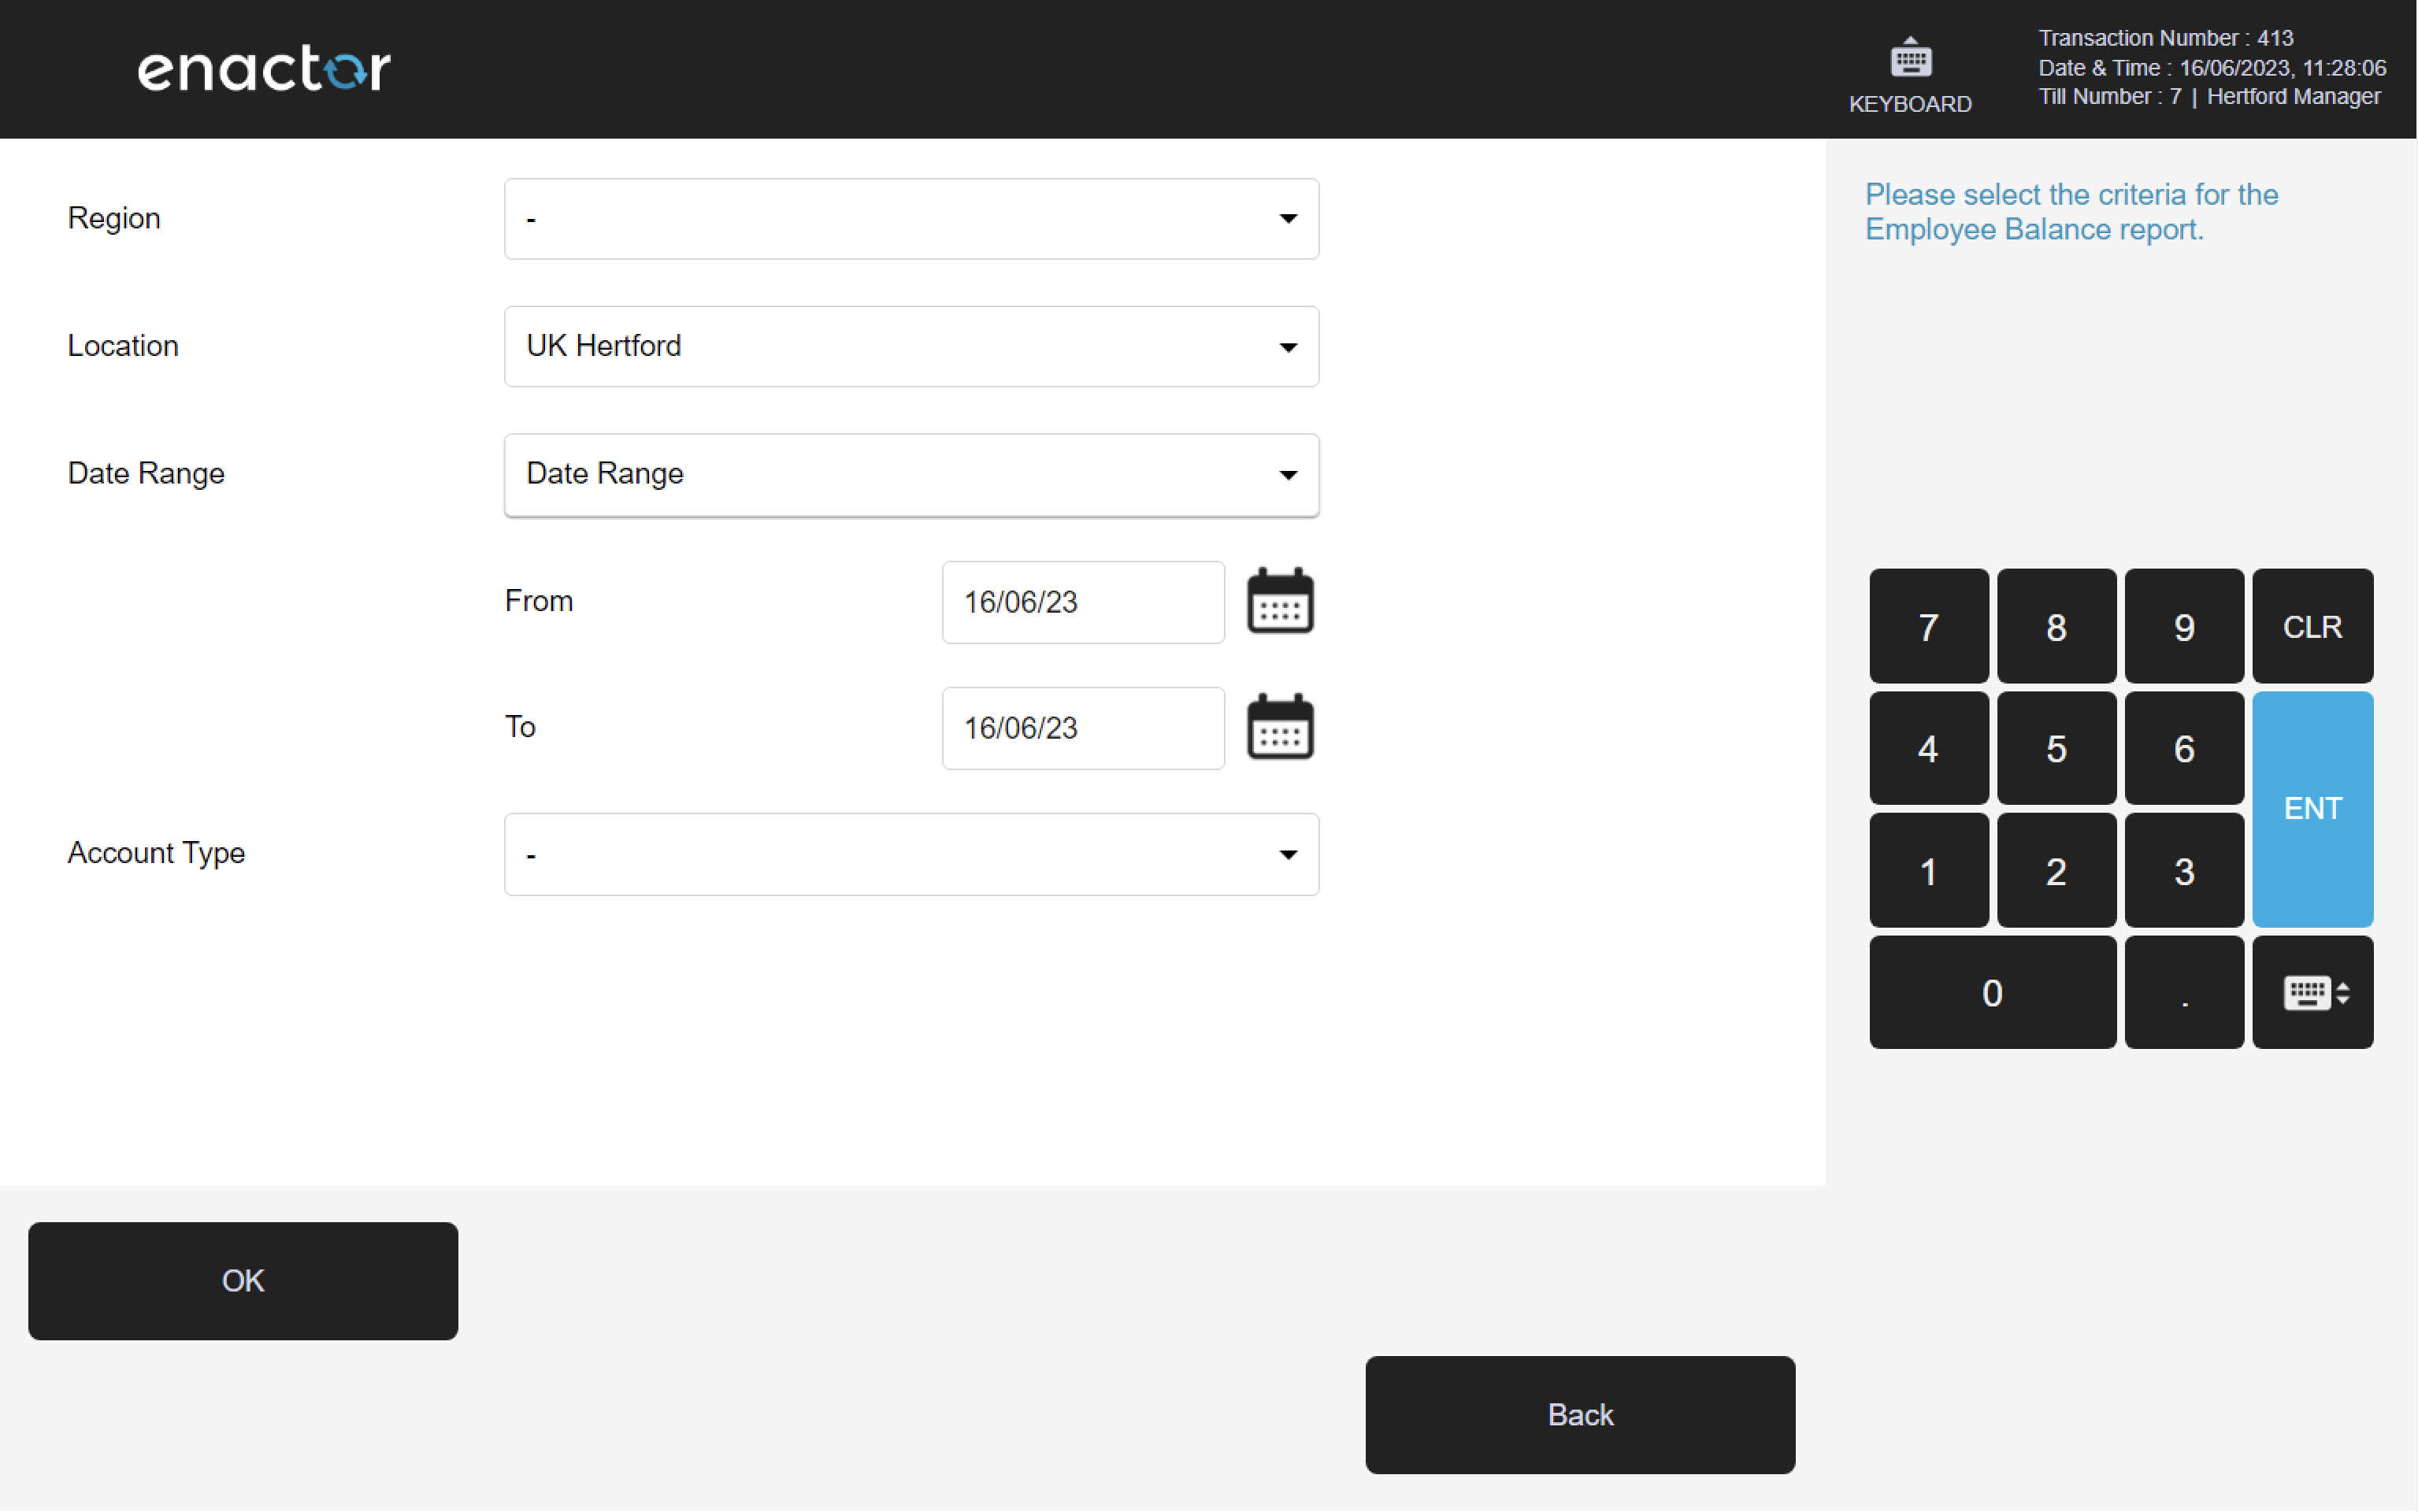
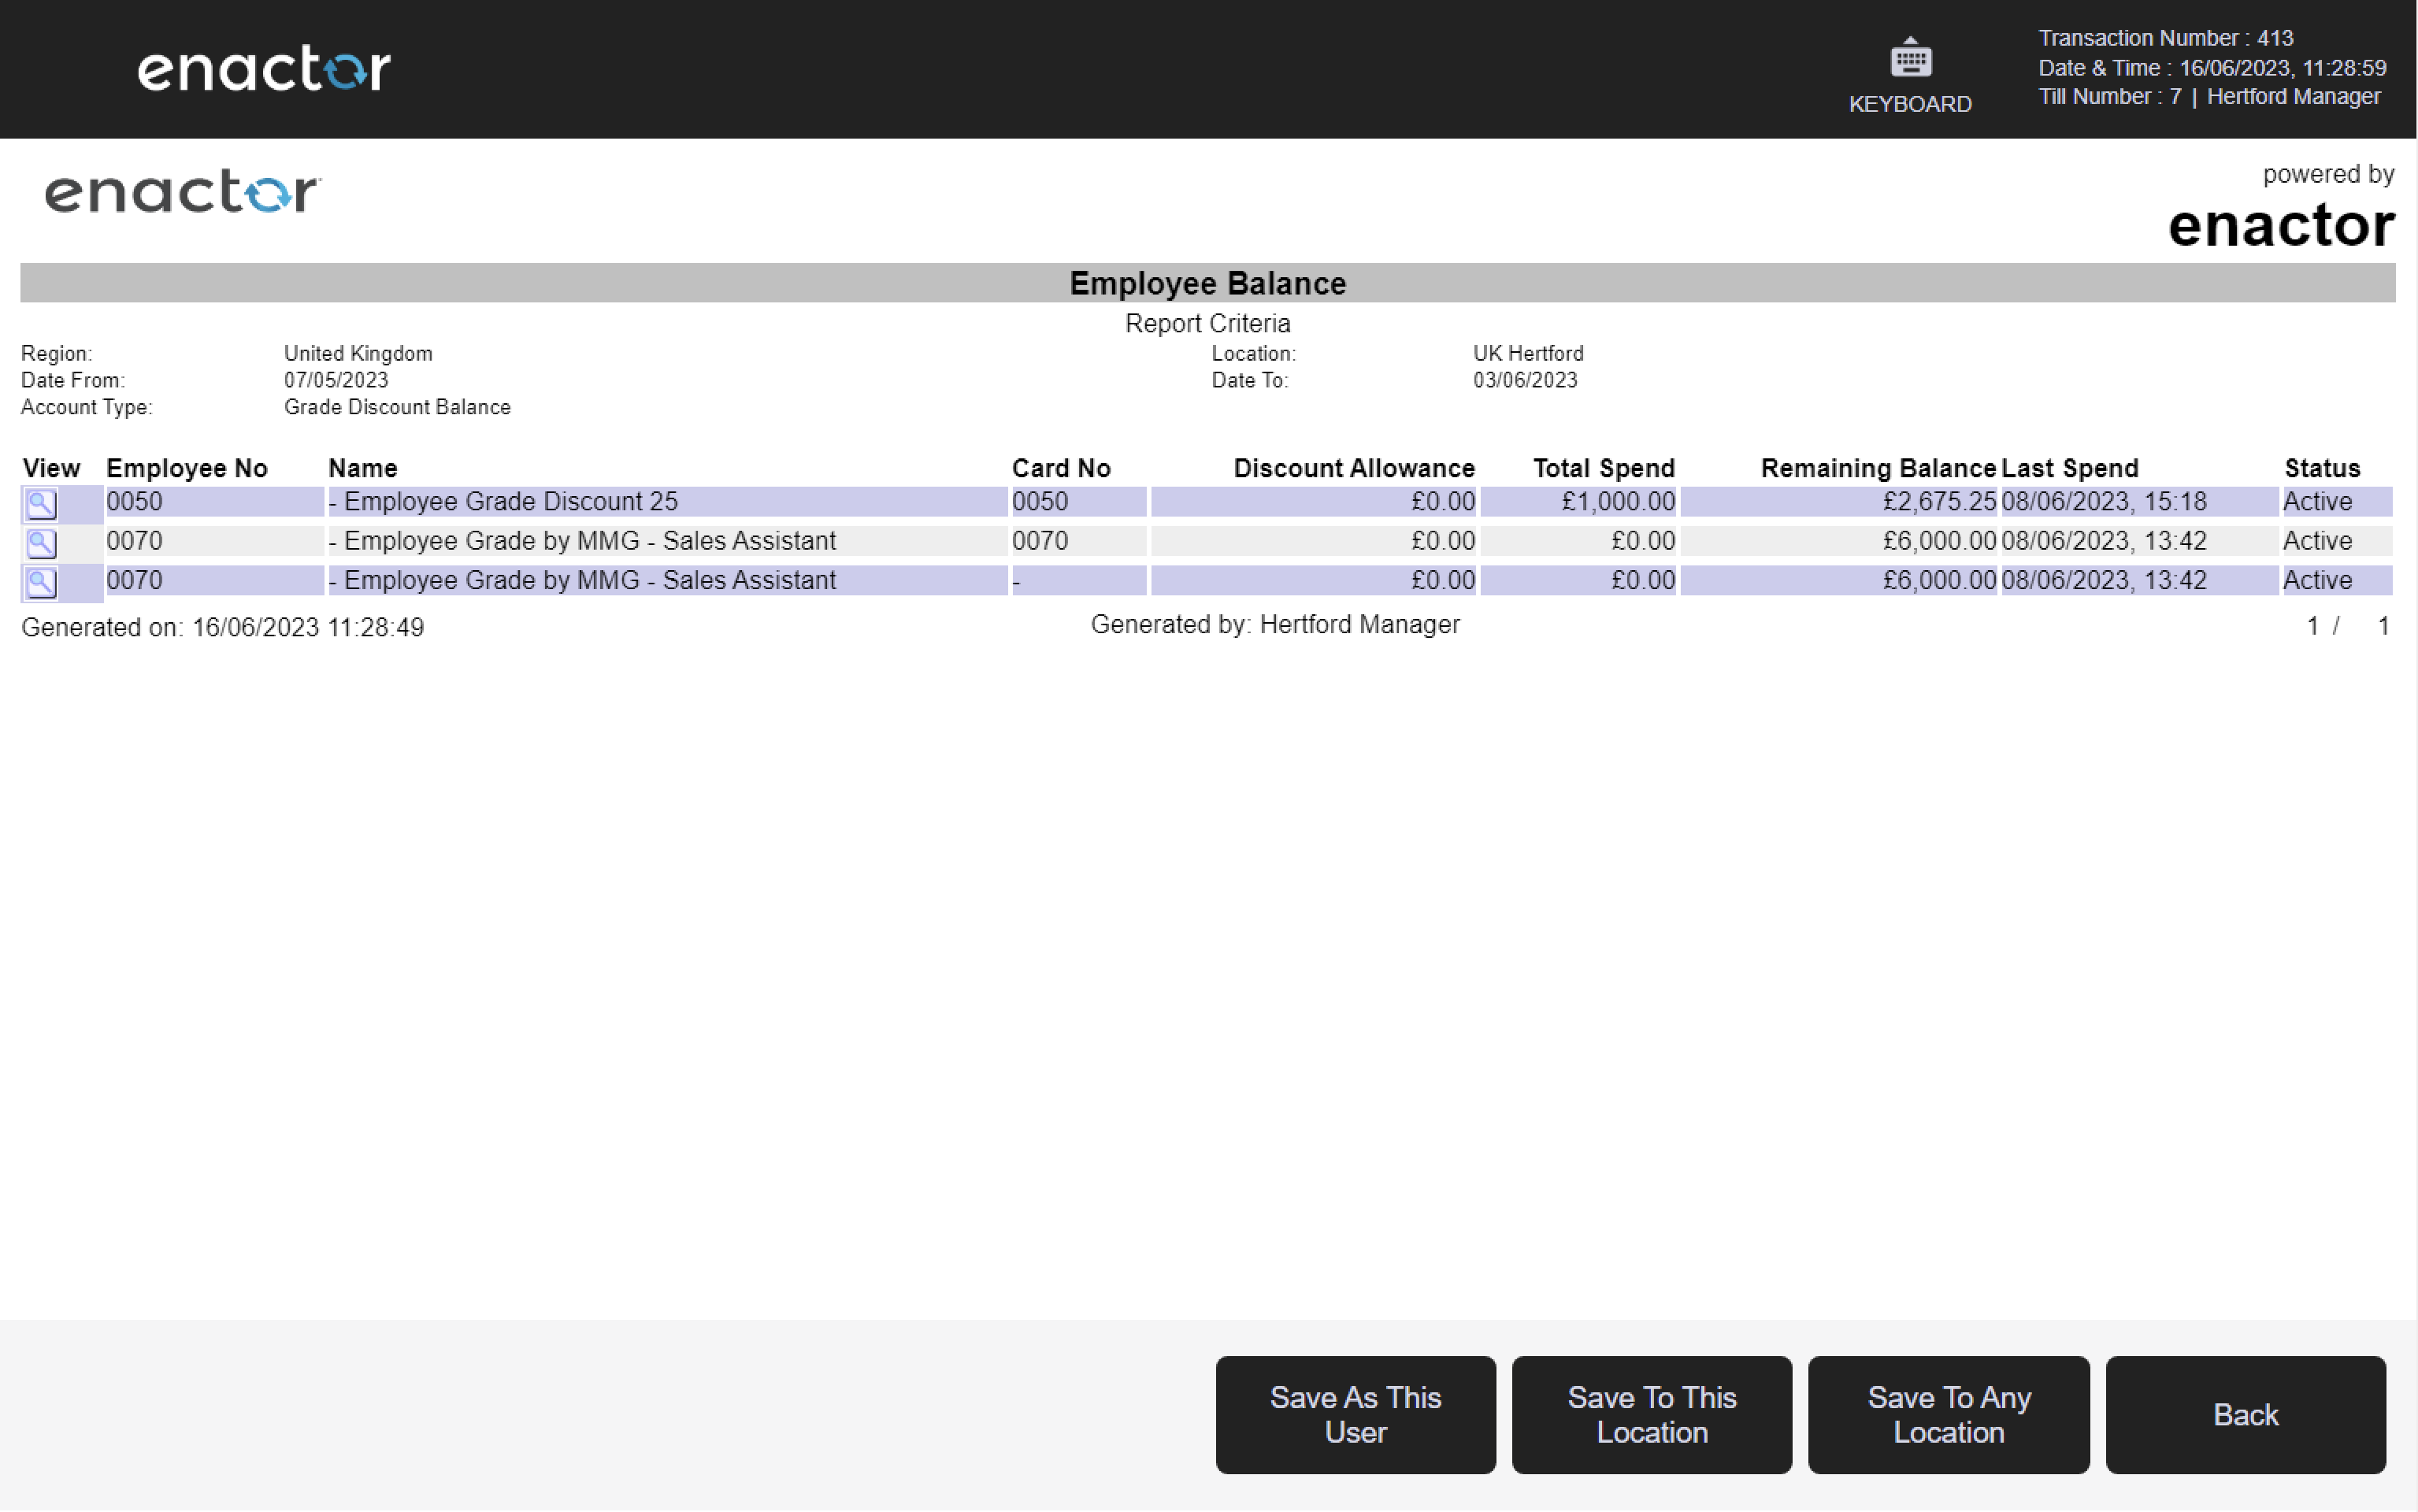
5.1 Employee Balance
Path: Employee Reports > Employee Balance
View employee balance information.
Filter Criteria
| Property | Description |
|---|---|
| Region | Dropdown selection of available regions. |
| Location | Dropdown selection of locations, filtered by the selected region. |
| Date Range | Date range selector with from/to date inputs. |
| Account Type | Dropdown selection of employee account type. |
Output Columns
| Property | Description |
|---|---|
| View | An icon to view the full detail of the employee balance record. |
| Employee No | The unique employee number. |
| Name | The employee's name. |
| Card No | The employee's card number. |
| Discount Allowance | The total discount allowance available to the employee. |
| Total Spend | The total amount spent by the employee within the selected period. |
| Remaining Balance | The remaining discount balance available to the employee. |
| Last Spend | The date and value of the employee's most recent spend. |
| Status | The current status of the employee account. |
6 Cash Management Reports
Path: Web Reports > Cash Management Reports
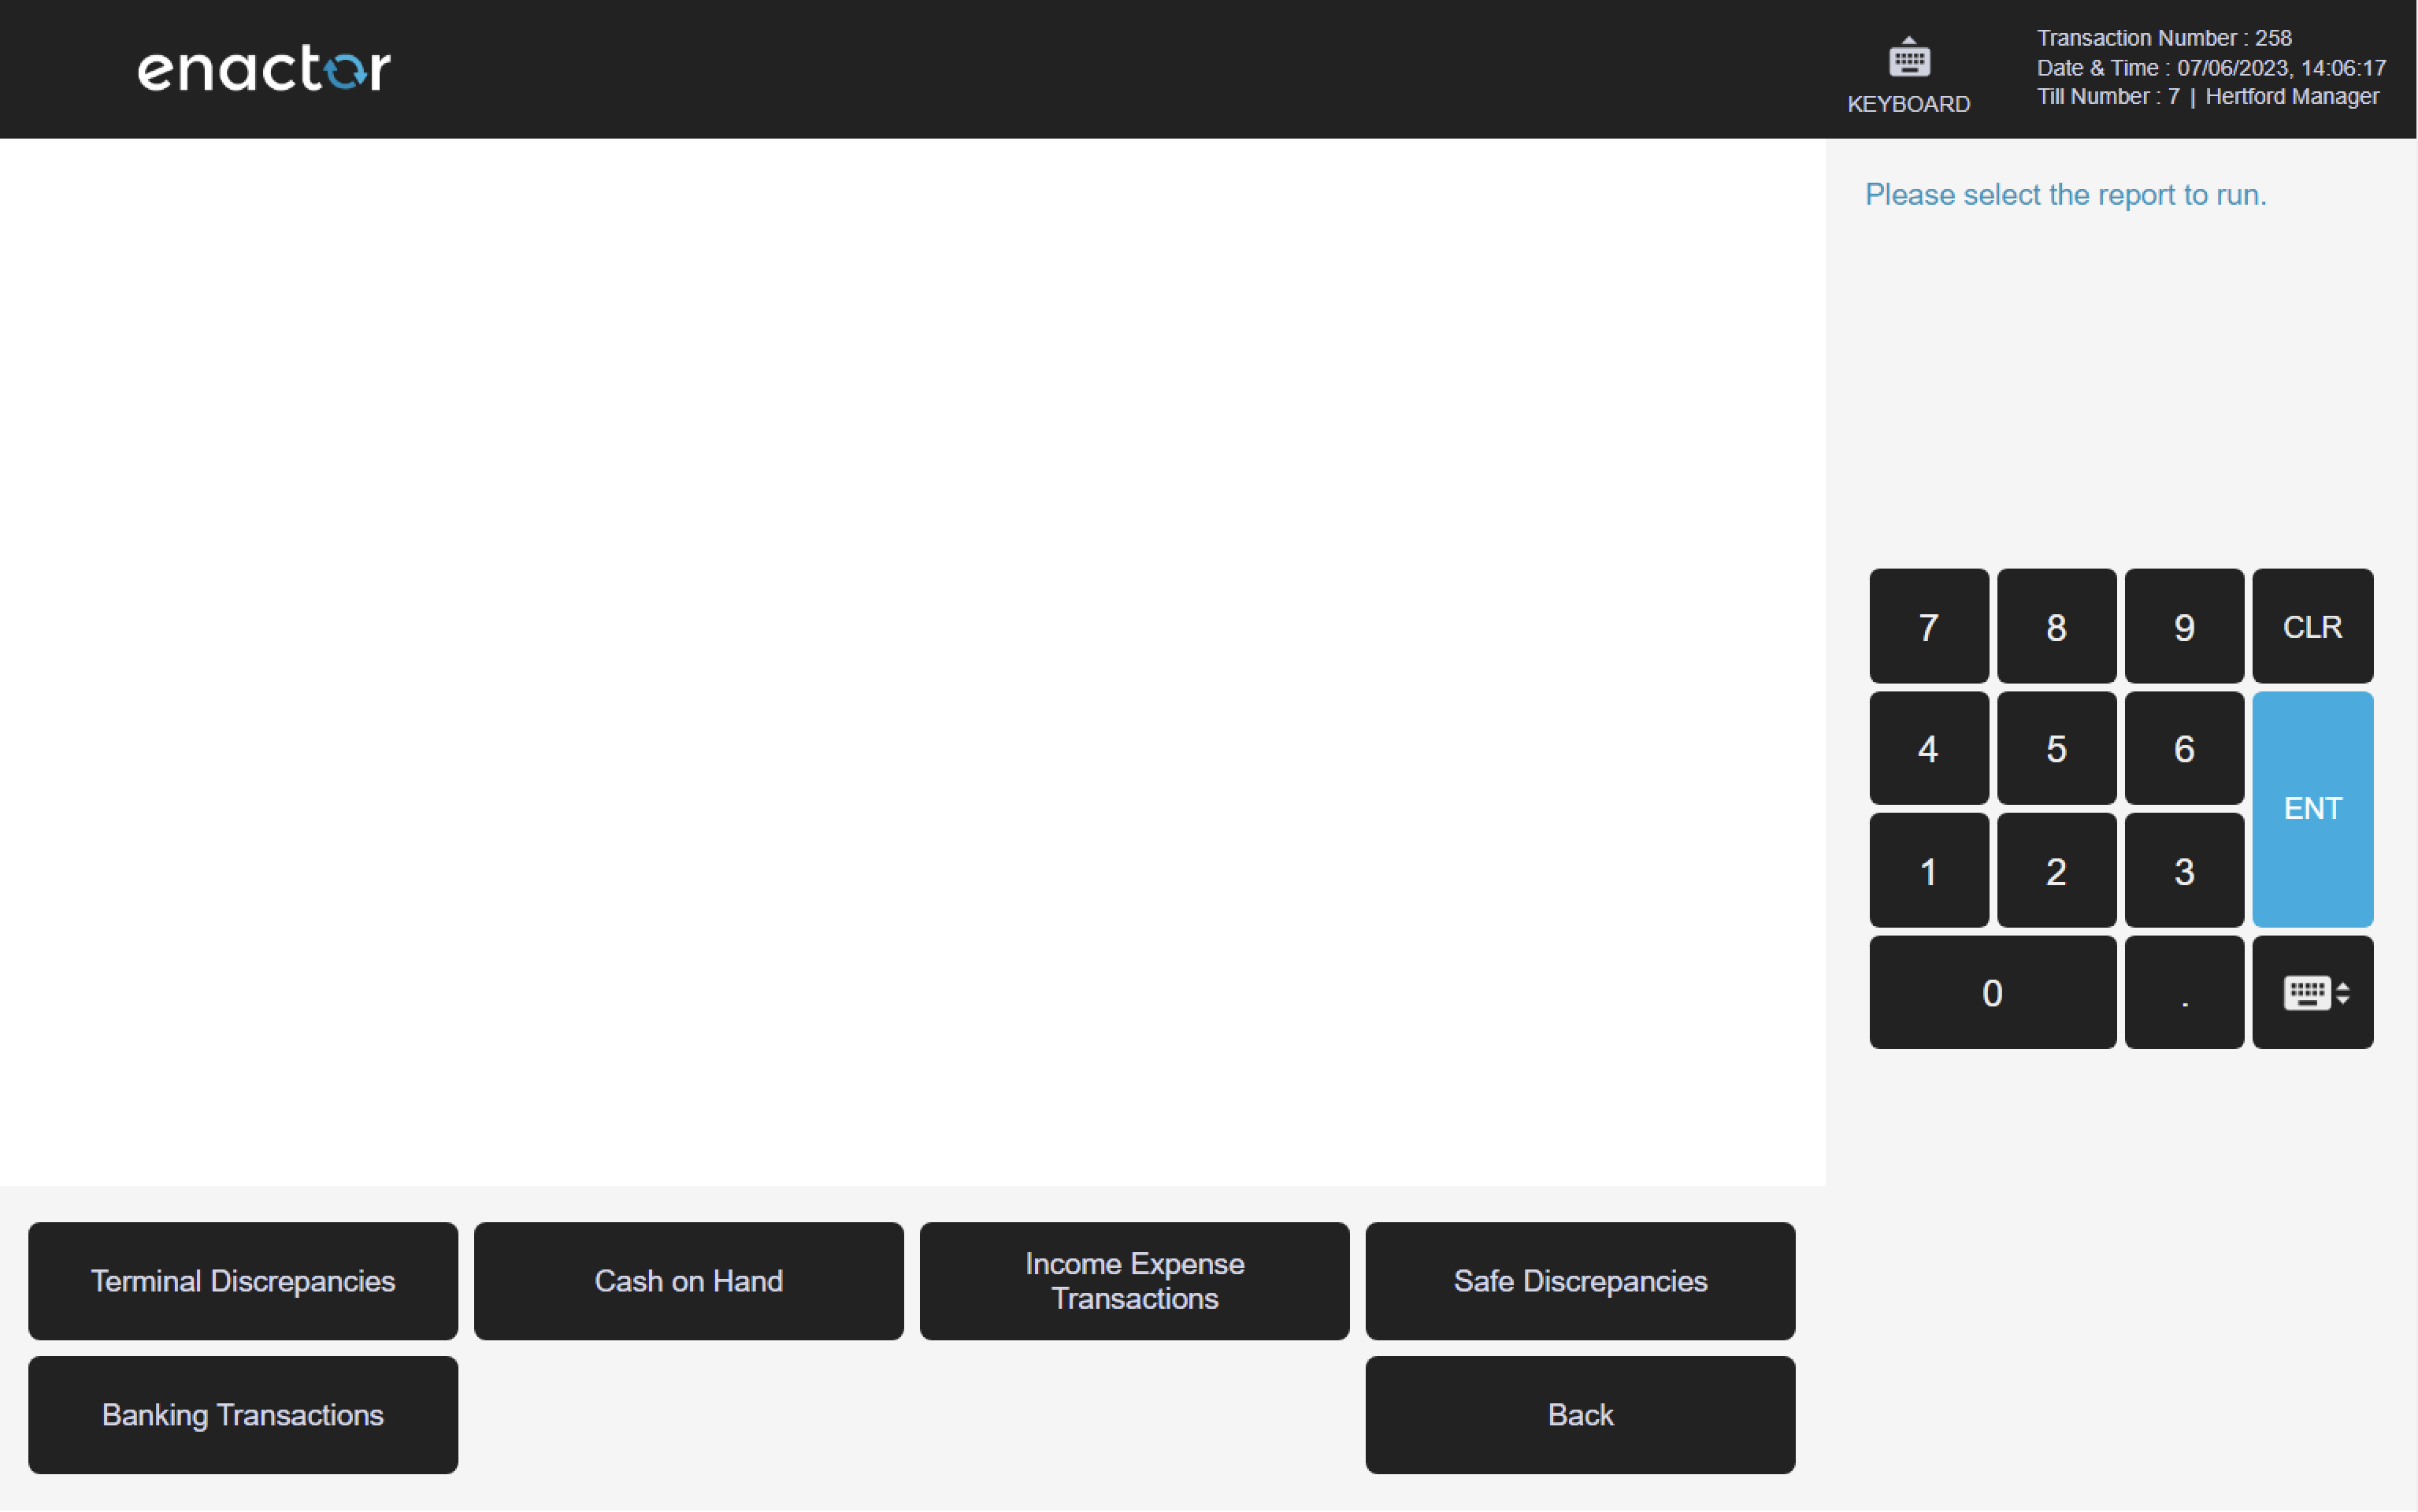
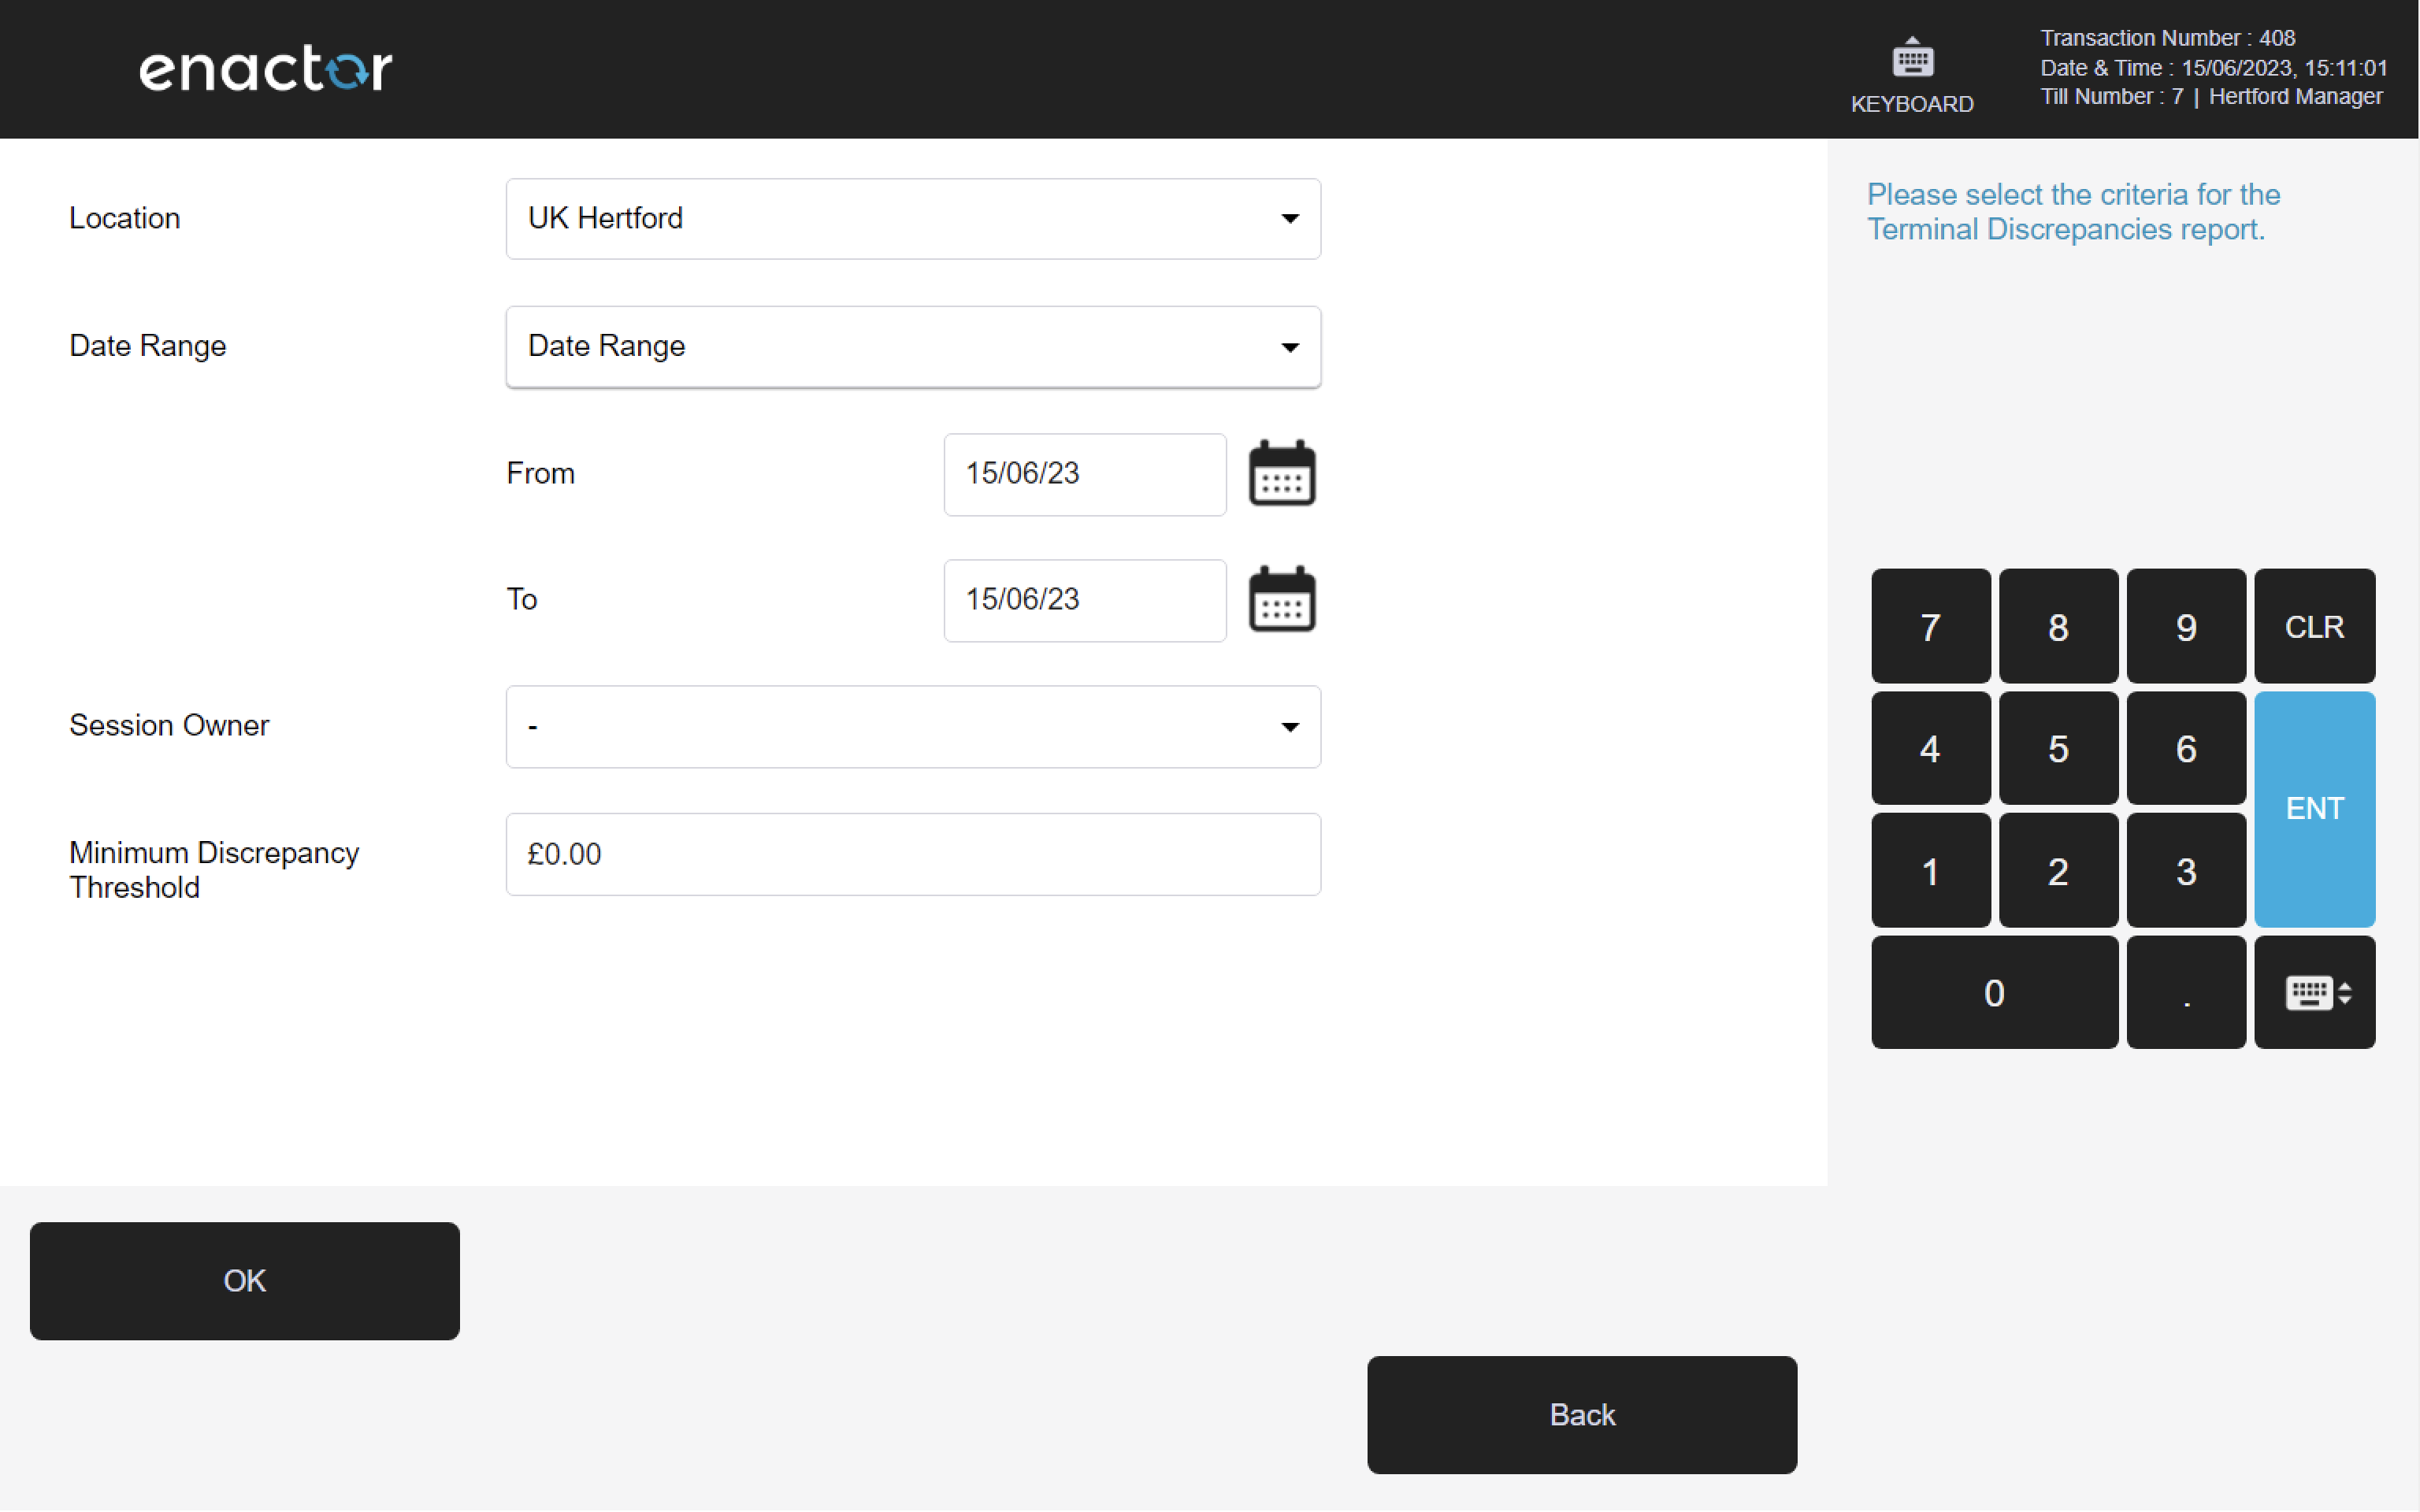
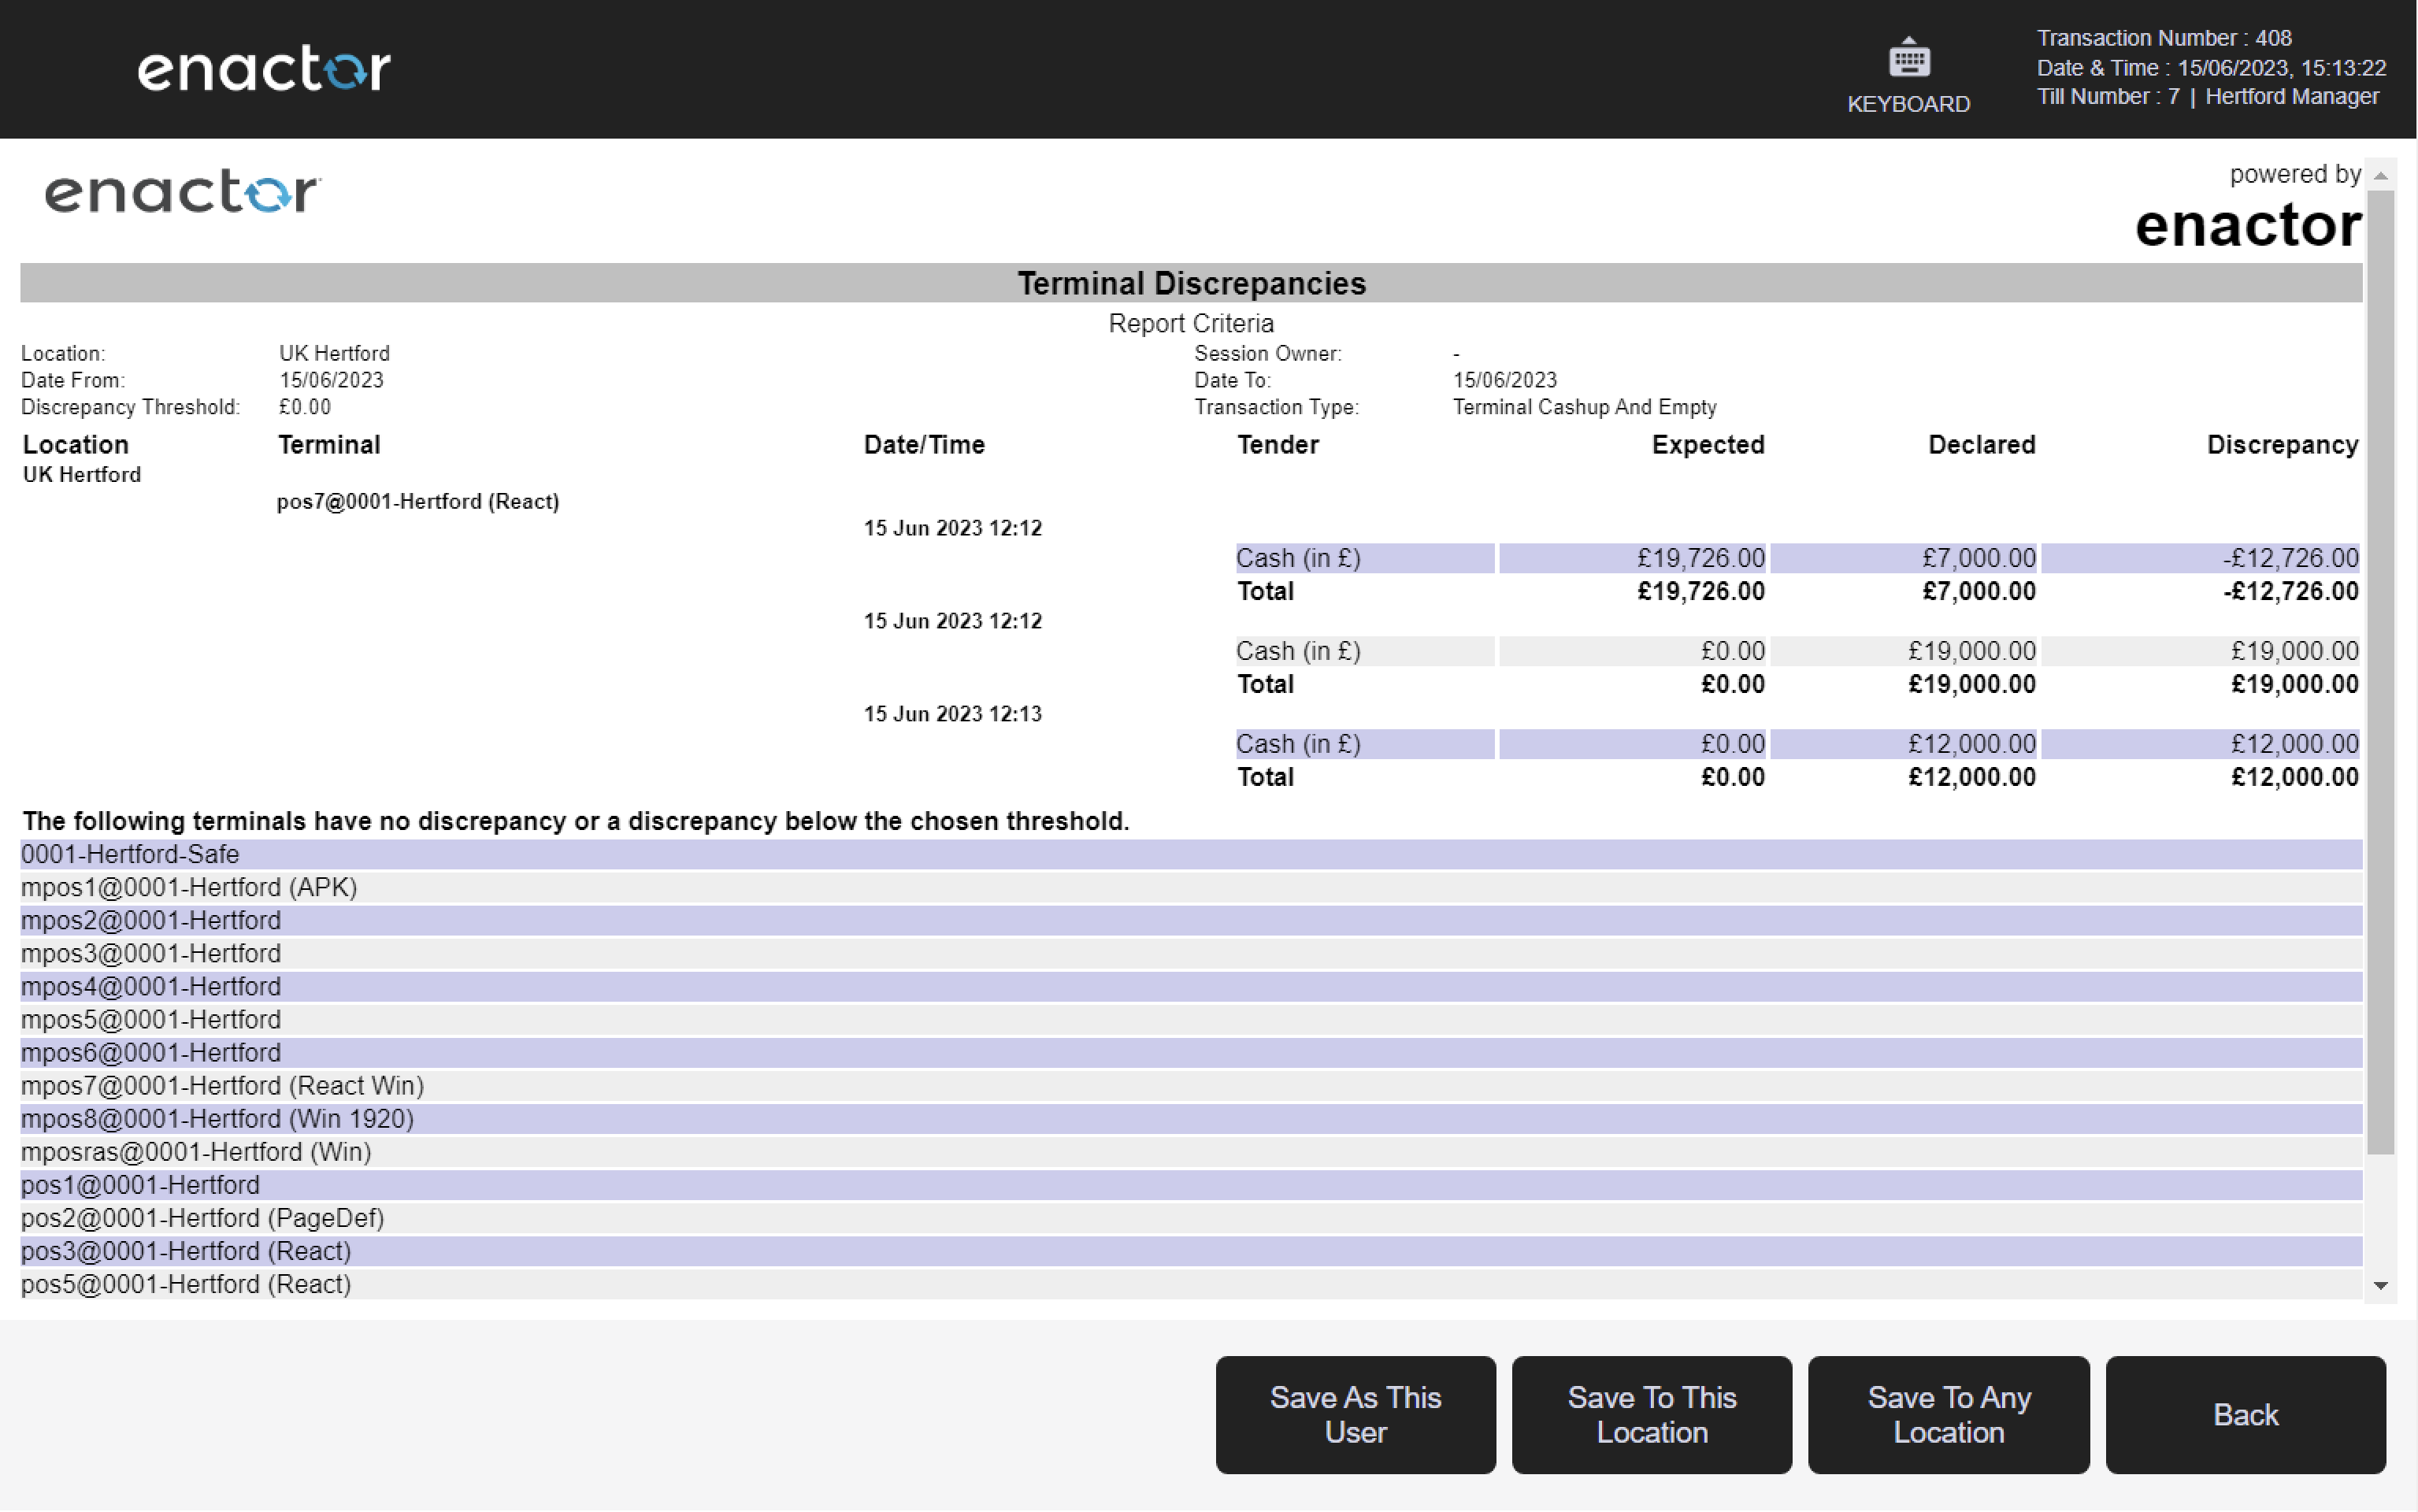
6.1 Terminal Discrepancies
Path: Cash Management Reports > Terminal Discrepancies
View terminal cash discrepancy information.
Filter Criteria
| Property | Description |
|---|---|
| Location | Dropdown selection of available locations. |
| Date Range | Date range selector with from/to date inputs. |
| Session Owner | Dropdown selection of the session owner. |
| Minimum Discrepancy Threshold | Numeric input to filter results to discrepancies above a minimum threshold value. |
Output Columns
| Property | Description |
|---|---|
| Location | The location associated with the terminal discrepancy. |
| Terminal | The terminal at which the discrepancy occurred. |
| Date/Time | The date and time of the discrepancy. |
| Tender | The tender type associated with the discrepancy. |
| Expected | The expected cash value at the terminal. |
| Declared | The declared cash value at the terminal. |
| Discrepancy | The difference between the expected and declared values. |
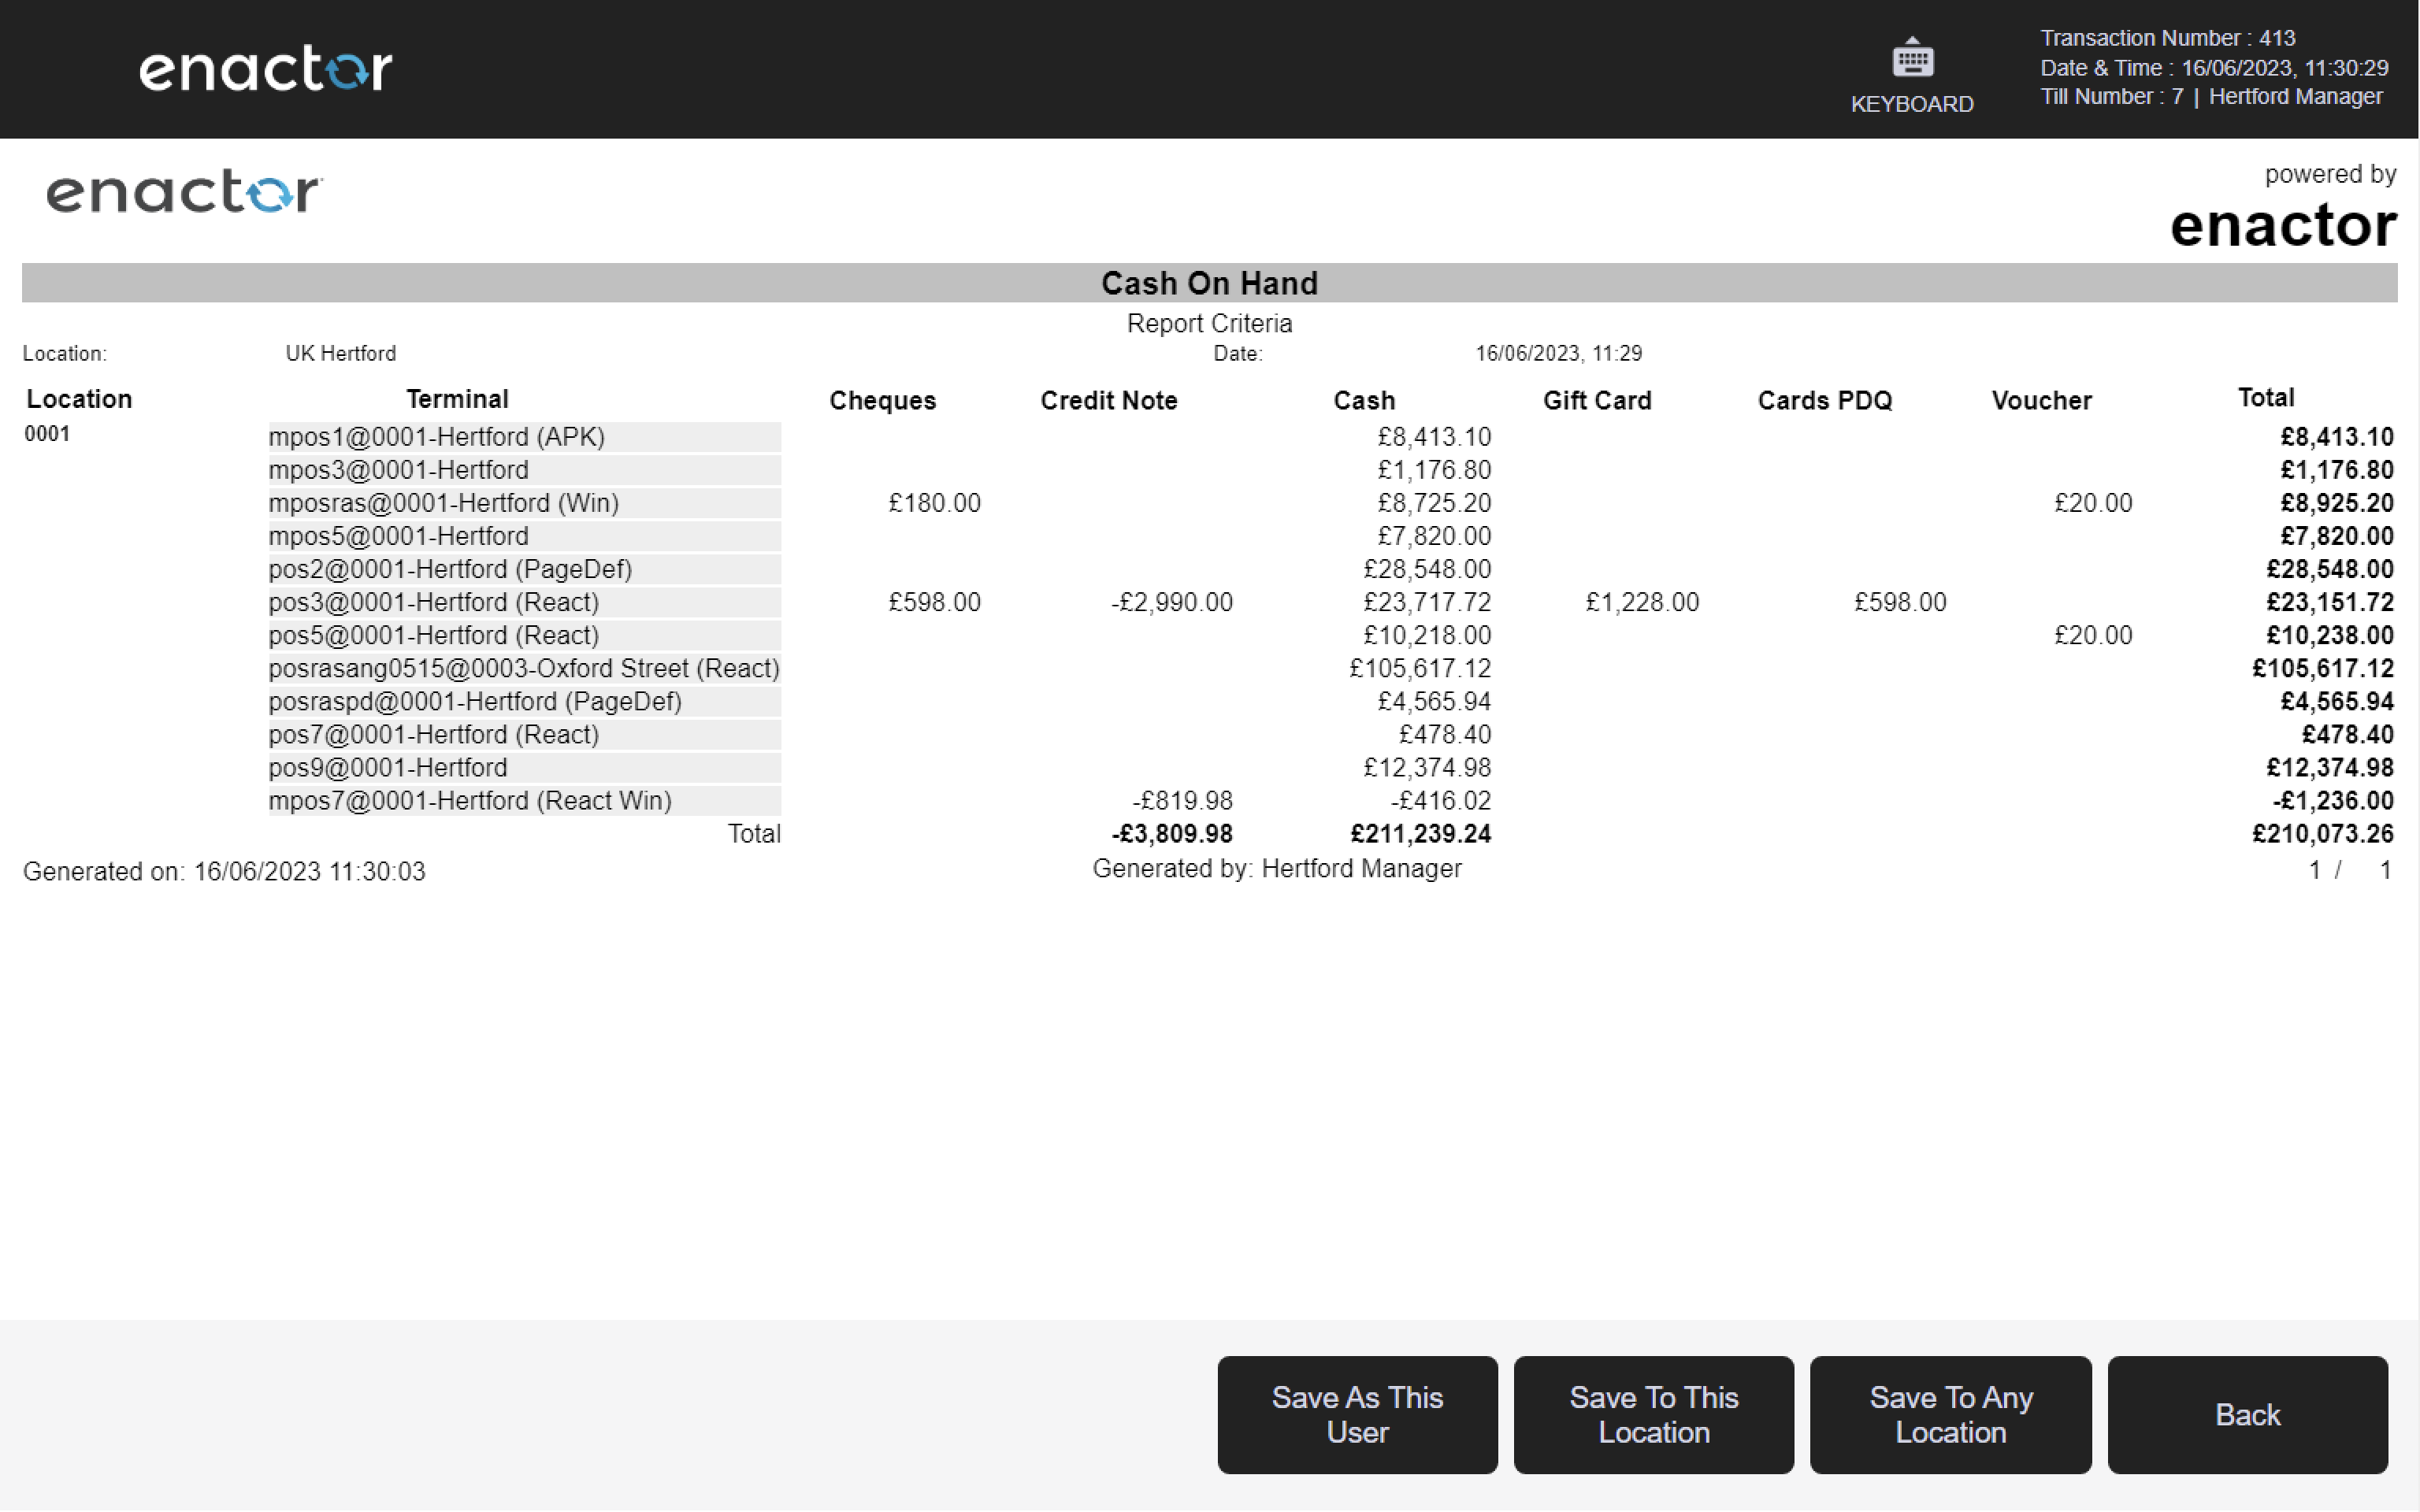
6.2 Cash on Hand
Path: Cash Management Reports > Cash on Hand
View cash on hand information.
Filter Criteria
| Property | Description |
|---|---|
| Location | Dropdown selection of available locations. |
| Date | Date and time input field to specify the point-in-time for the report. |

Output Columns
| Property | Description |
|---|---|
| Location | The location for which cash on hand is reported. |
| Terminal | The terminal or cash point. |
| Customer Account | The customer account balance held at the terminal (if applicable). |
| [Tender columns] | A column for each configured tender type, showing the value held for that tender at the terminal. |
| Total | The total value of all tenders held at the terminal. Grand totals are shown at the bottom of each column. |
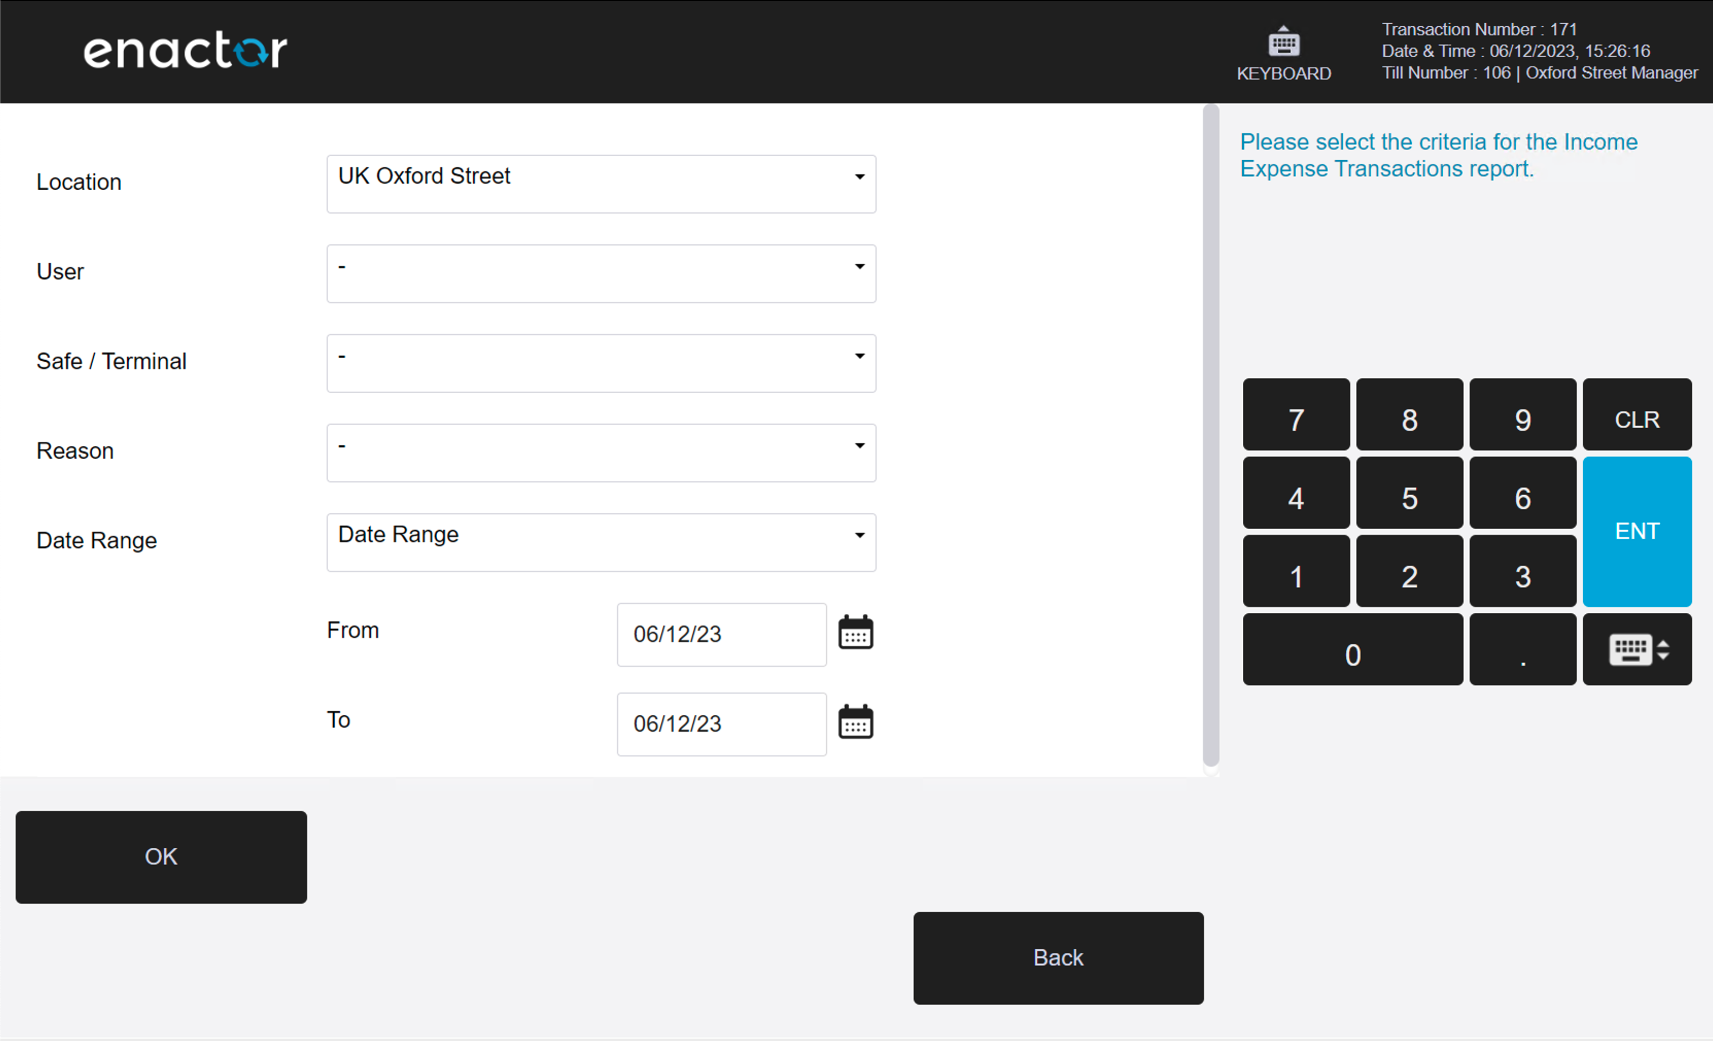
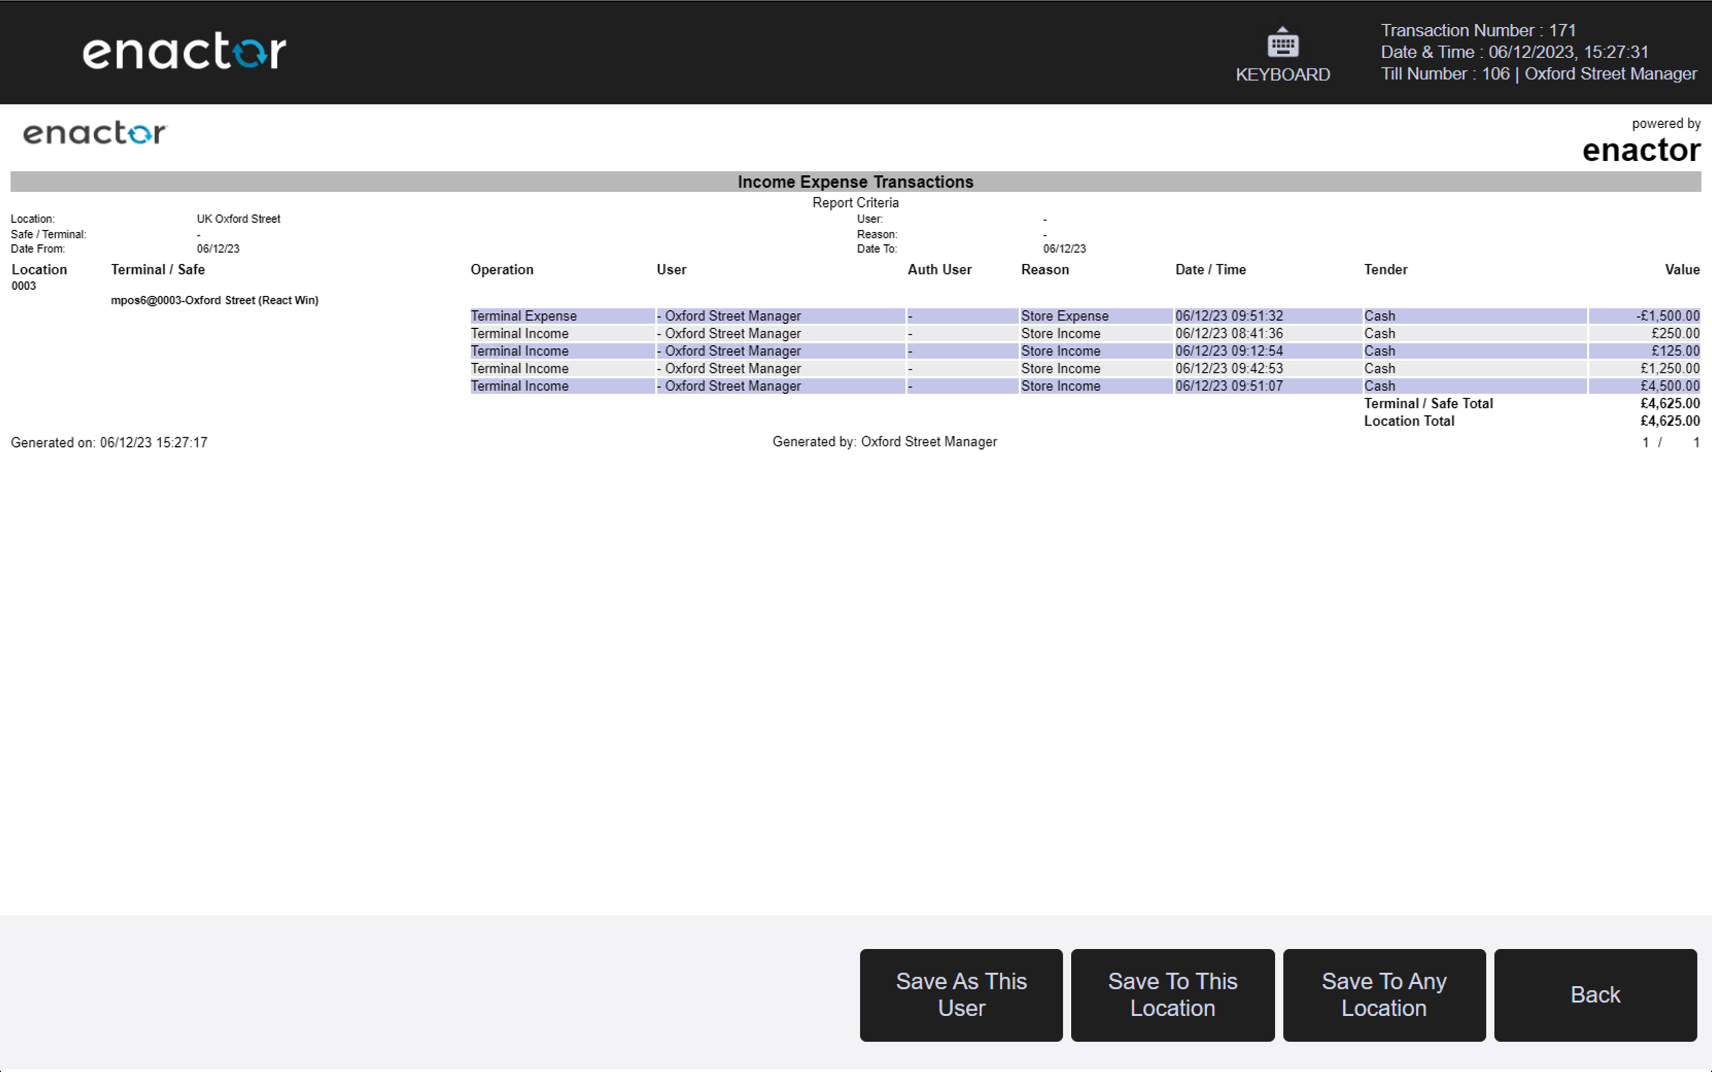
6.3 Income Expense Transactions
Path: Cash Management Reports > Income Expense Transactions
View income and expense transaction information.
Filter Criteria
| Property | Description |
|---|---|
| Location | Dropdown selection of available locations. |
| User | Dropdown selection of user. |
| Safe / Terminal | Dropdown to filter by Safe or Terminal. |
| Reason | Dropdown selection of income/expense reason. |
| Date Range | Date range selector with from/to date inputs. |
Output Columns
| Property | Description |
|---|---|
| Location | The location where the income or expense transaction occurred. |
| Terminal / Safe | The terminal or safe associated with the transaction. |
| Operation | The type of operation (income or expense). |
| User | The user who performed the transaction. |
| Auth User | The user who authorised the transaction. |
| Reason | The reason code associated with the transaction. |
| Date / Time | The date and time of the transaction. |
| Tender | The tender type used in the transaction. |
| Value | The value of the transaction. |
| Terminal / Safe Total | The running total for the terminal or safe at the time of the transaction. |
| Location Total | The running total for the location at the time of the transaction. |
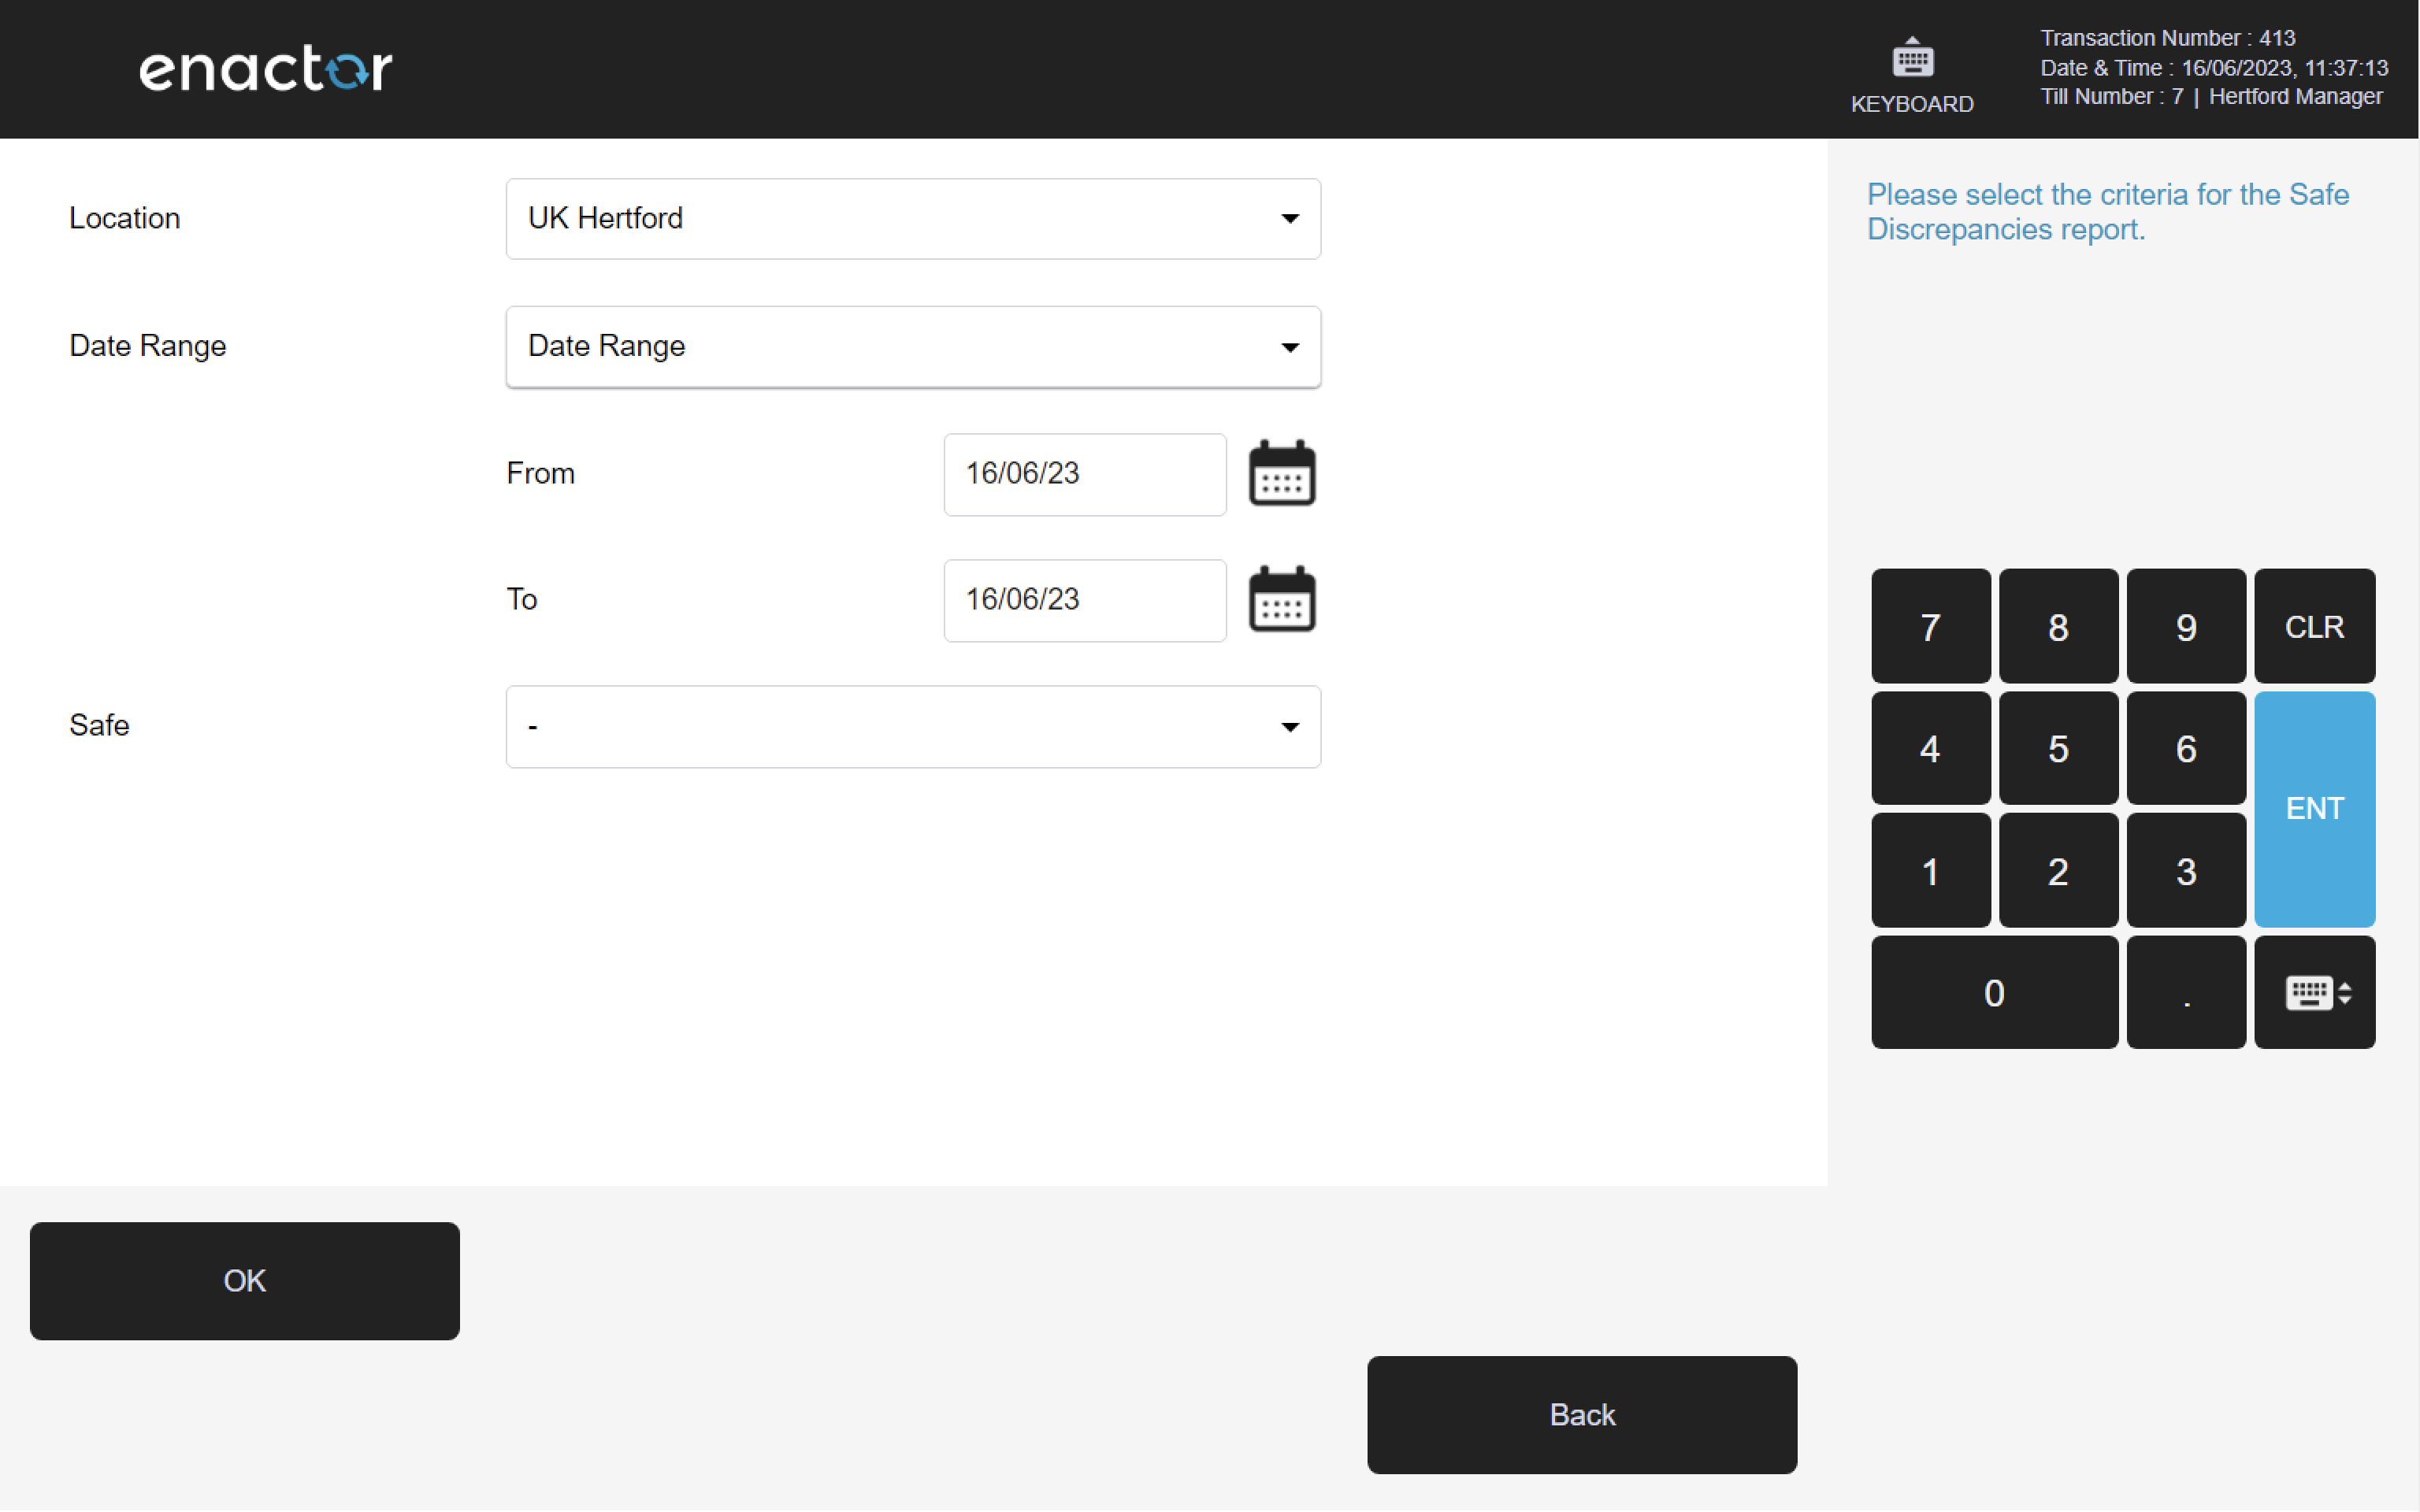
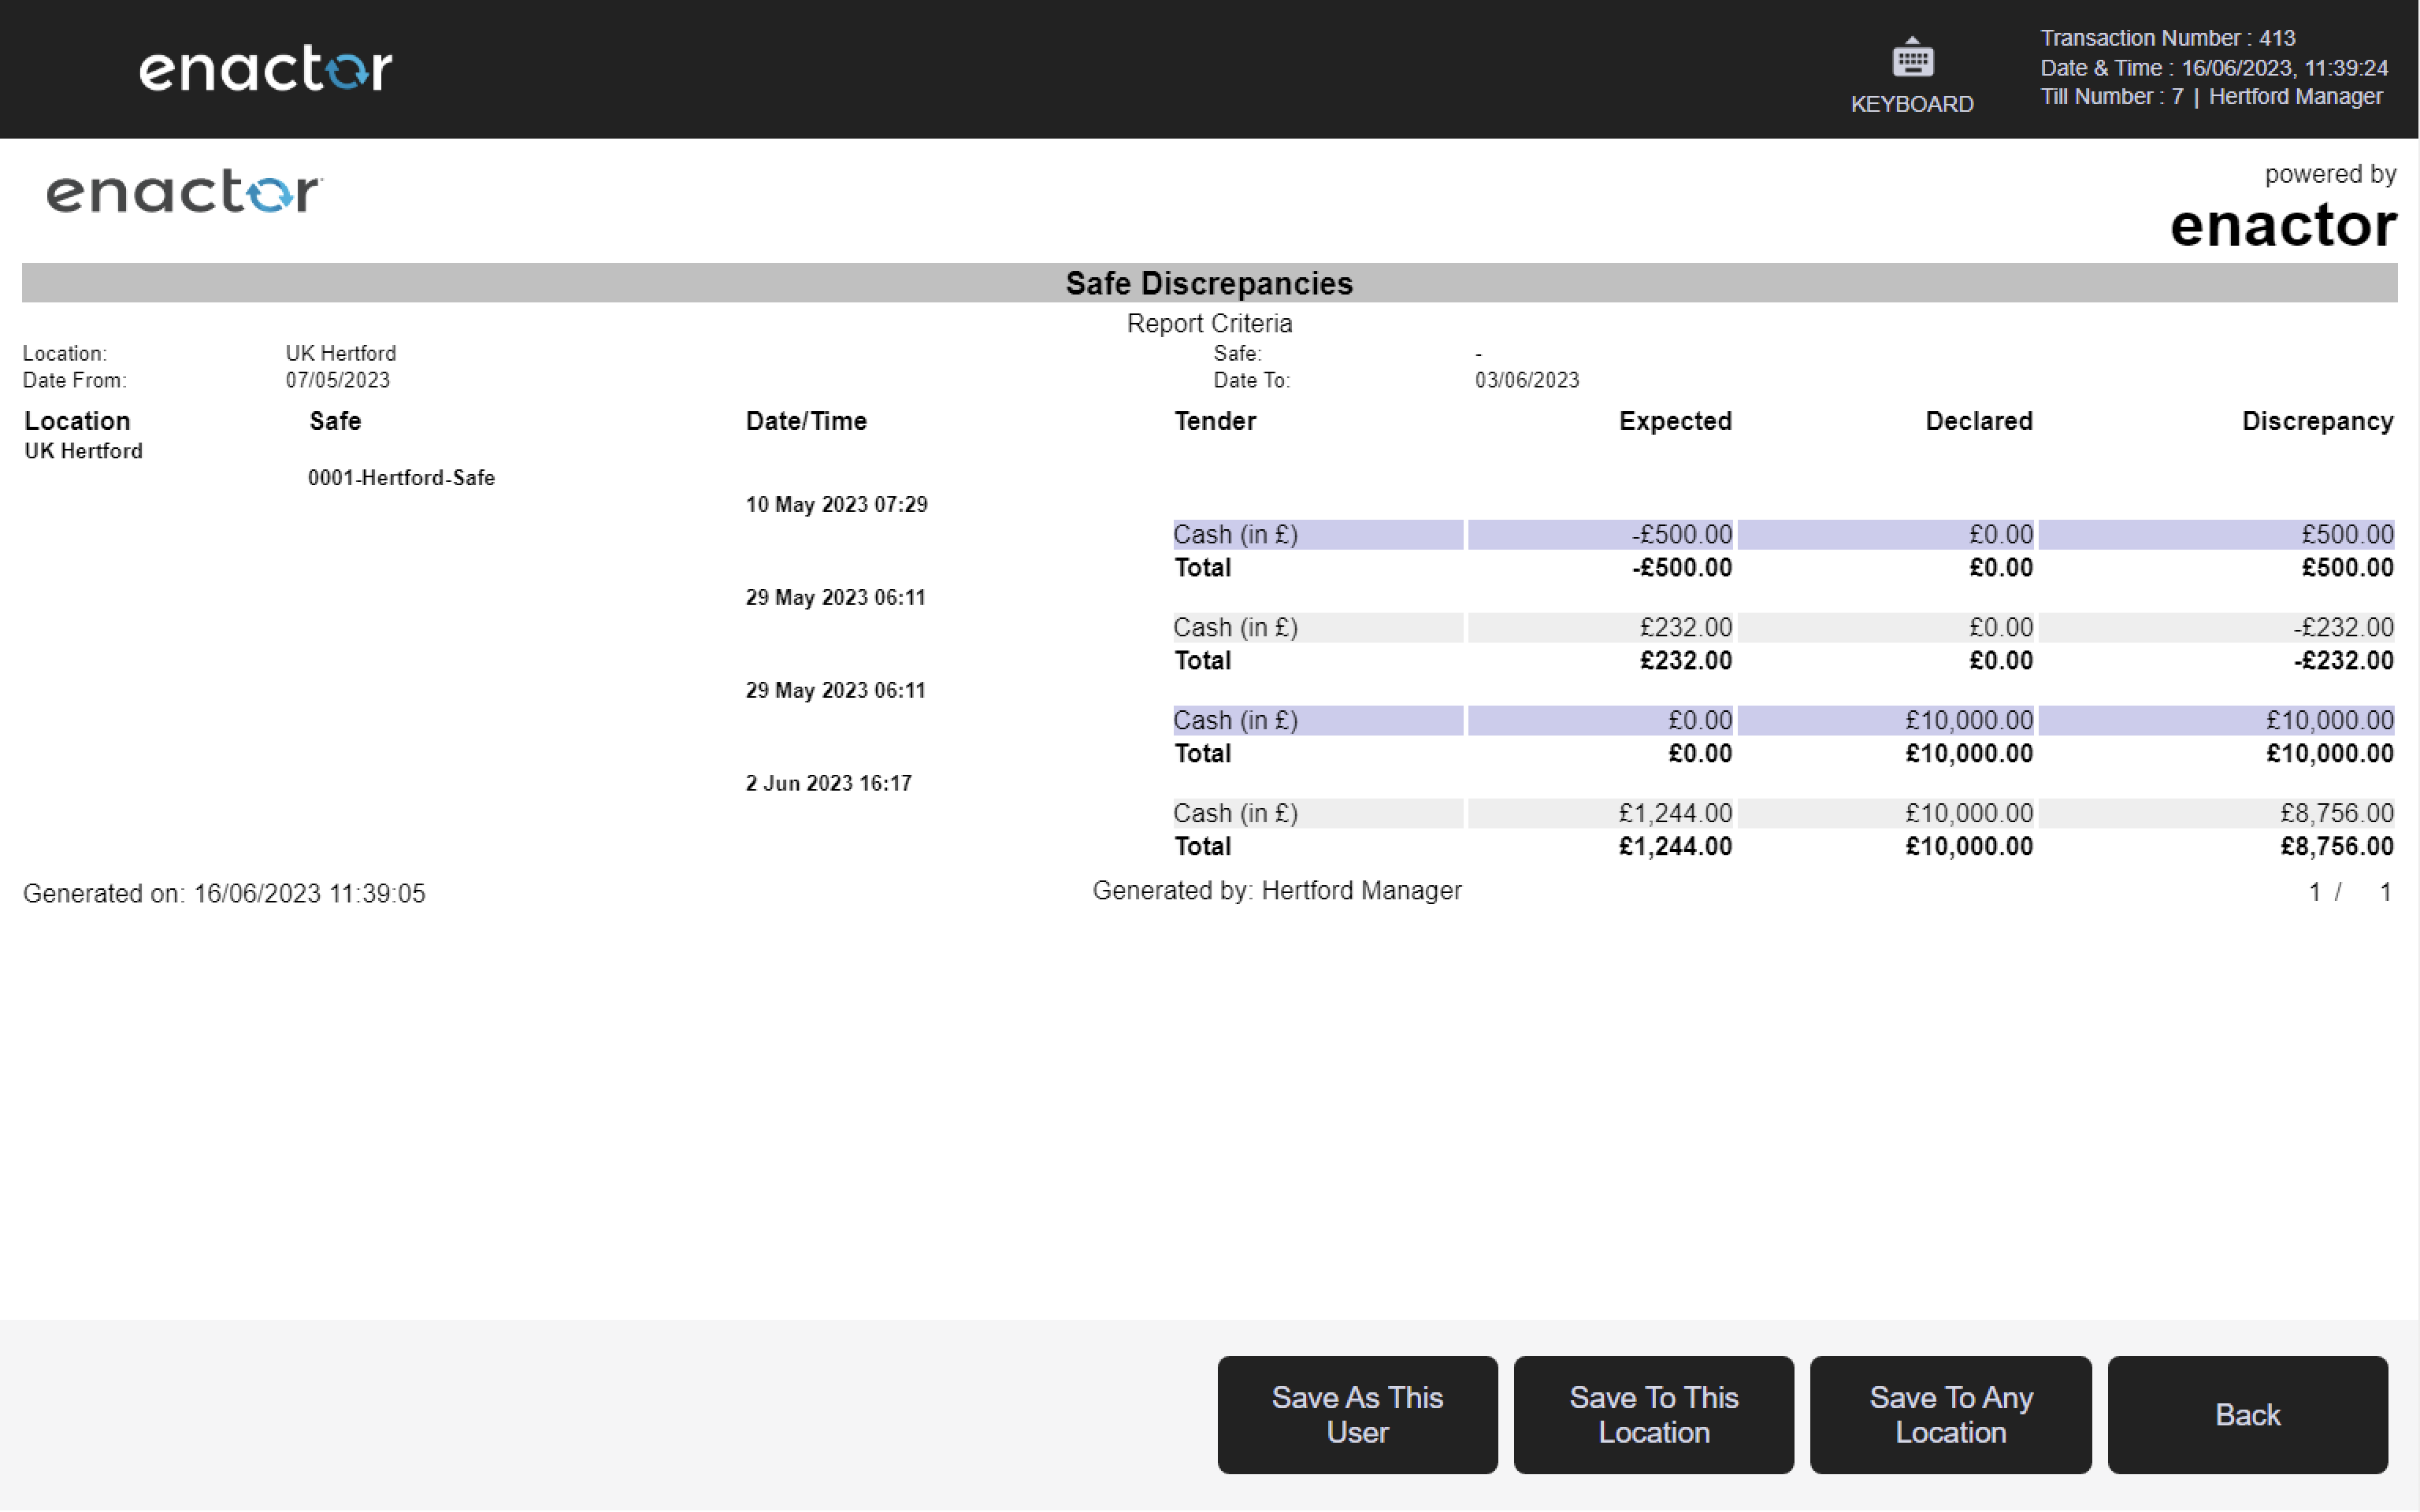
6.4 Safe Discrepancies
Path: Cash Management Reports > Safe Discrepancies
View safe cash discrepancy information.
Filter Criteria
| Property | Description |
|---|---|
| Location | Dropdown selection of available locations. |
| Date Range | Date range selector with from/to date inputs. |
| Safe | Dropdown selection of safe, filtered by the selected location. |
Output Columns
| Property | Description |
|---|---|
| Location | The location associated with the safe discrepancy. |
| Safe | The safe at which the discrepancy occurred. |
| Date/Time | The date and time of the discrepancy. |
| Tender | The tender type associated with the discrepancy. |
| Expected | The expected value in the safe. |
| Declared | The declared value in the safe. |
| Discrepancy | The difference between the expected and declared values. |
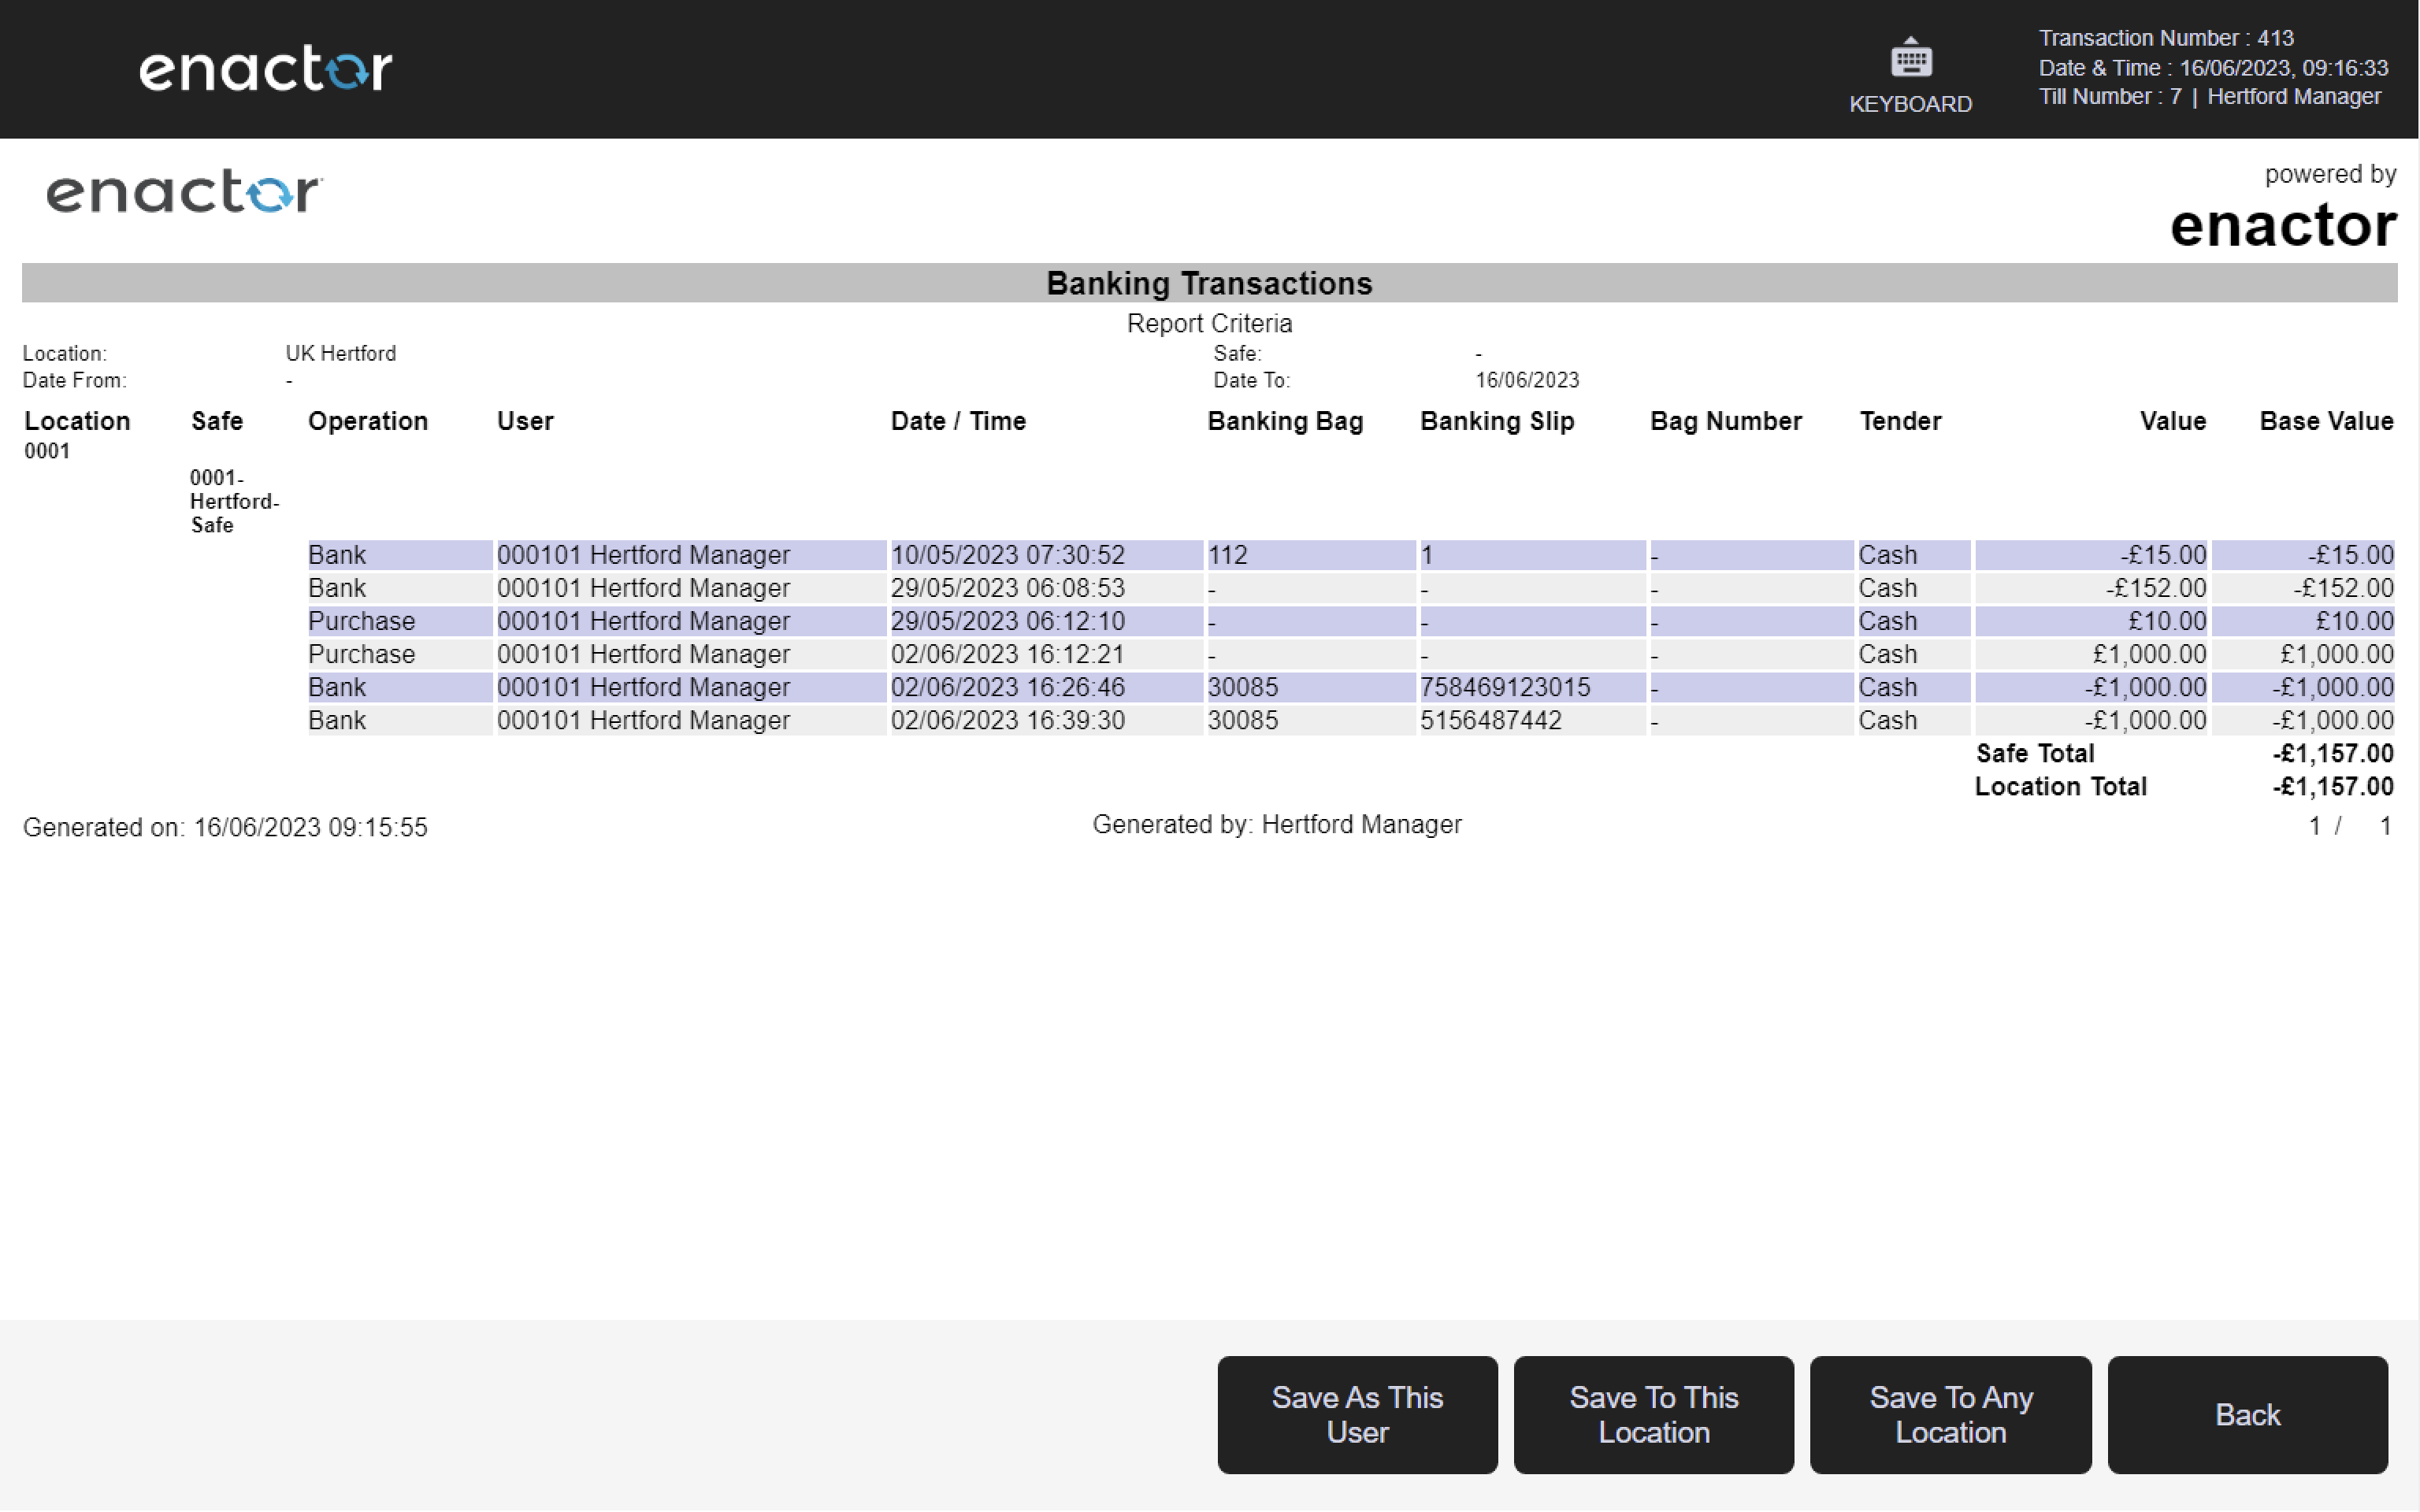
6.5 Banking Transaction
Path: Cash Management Reports > Banking Transaction
View banking transaction information.
Filter Criteria
| Property | Description |
|---|---|
| Location | Dropdown selection of available locations. |
| Safe | Dropdown selection of safe, filtered by the selected location. |
| Date Range | Date range selector with from/to date inputs. |

Output Columns
| Property | Description |
|---|---|
| Location | The location associated with the banking transaction. |
| Safe | The safe from which the banking transaction was made. |
| Operation | The type of banking operation performed. |
| User | The user who performed the transaction. |
| Date / Time | The date and time of the banking transaction. |
| Banking Bag | The banking bag identifier used in the transaction. |
| Banking Slip | The banking slip identifier. |
| Bag Number | The bag number associated with the transaction. |
| Tender | The tender type included in the banking transaction. |
| Value | The value of the tender in the banking transaction. |
| Base Value | The value expressed in the base currency. |
7 ICC Reader Reports
Path: Web Reports > ICC Reader Reports
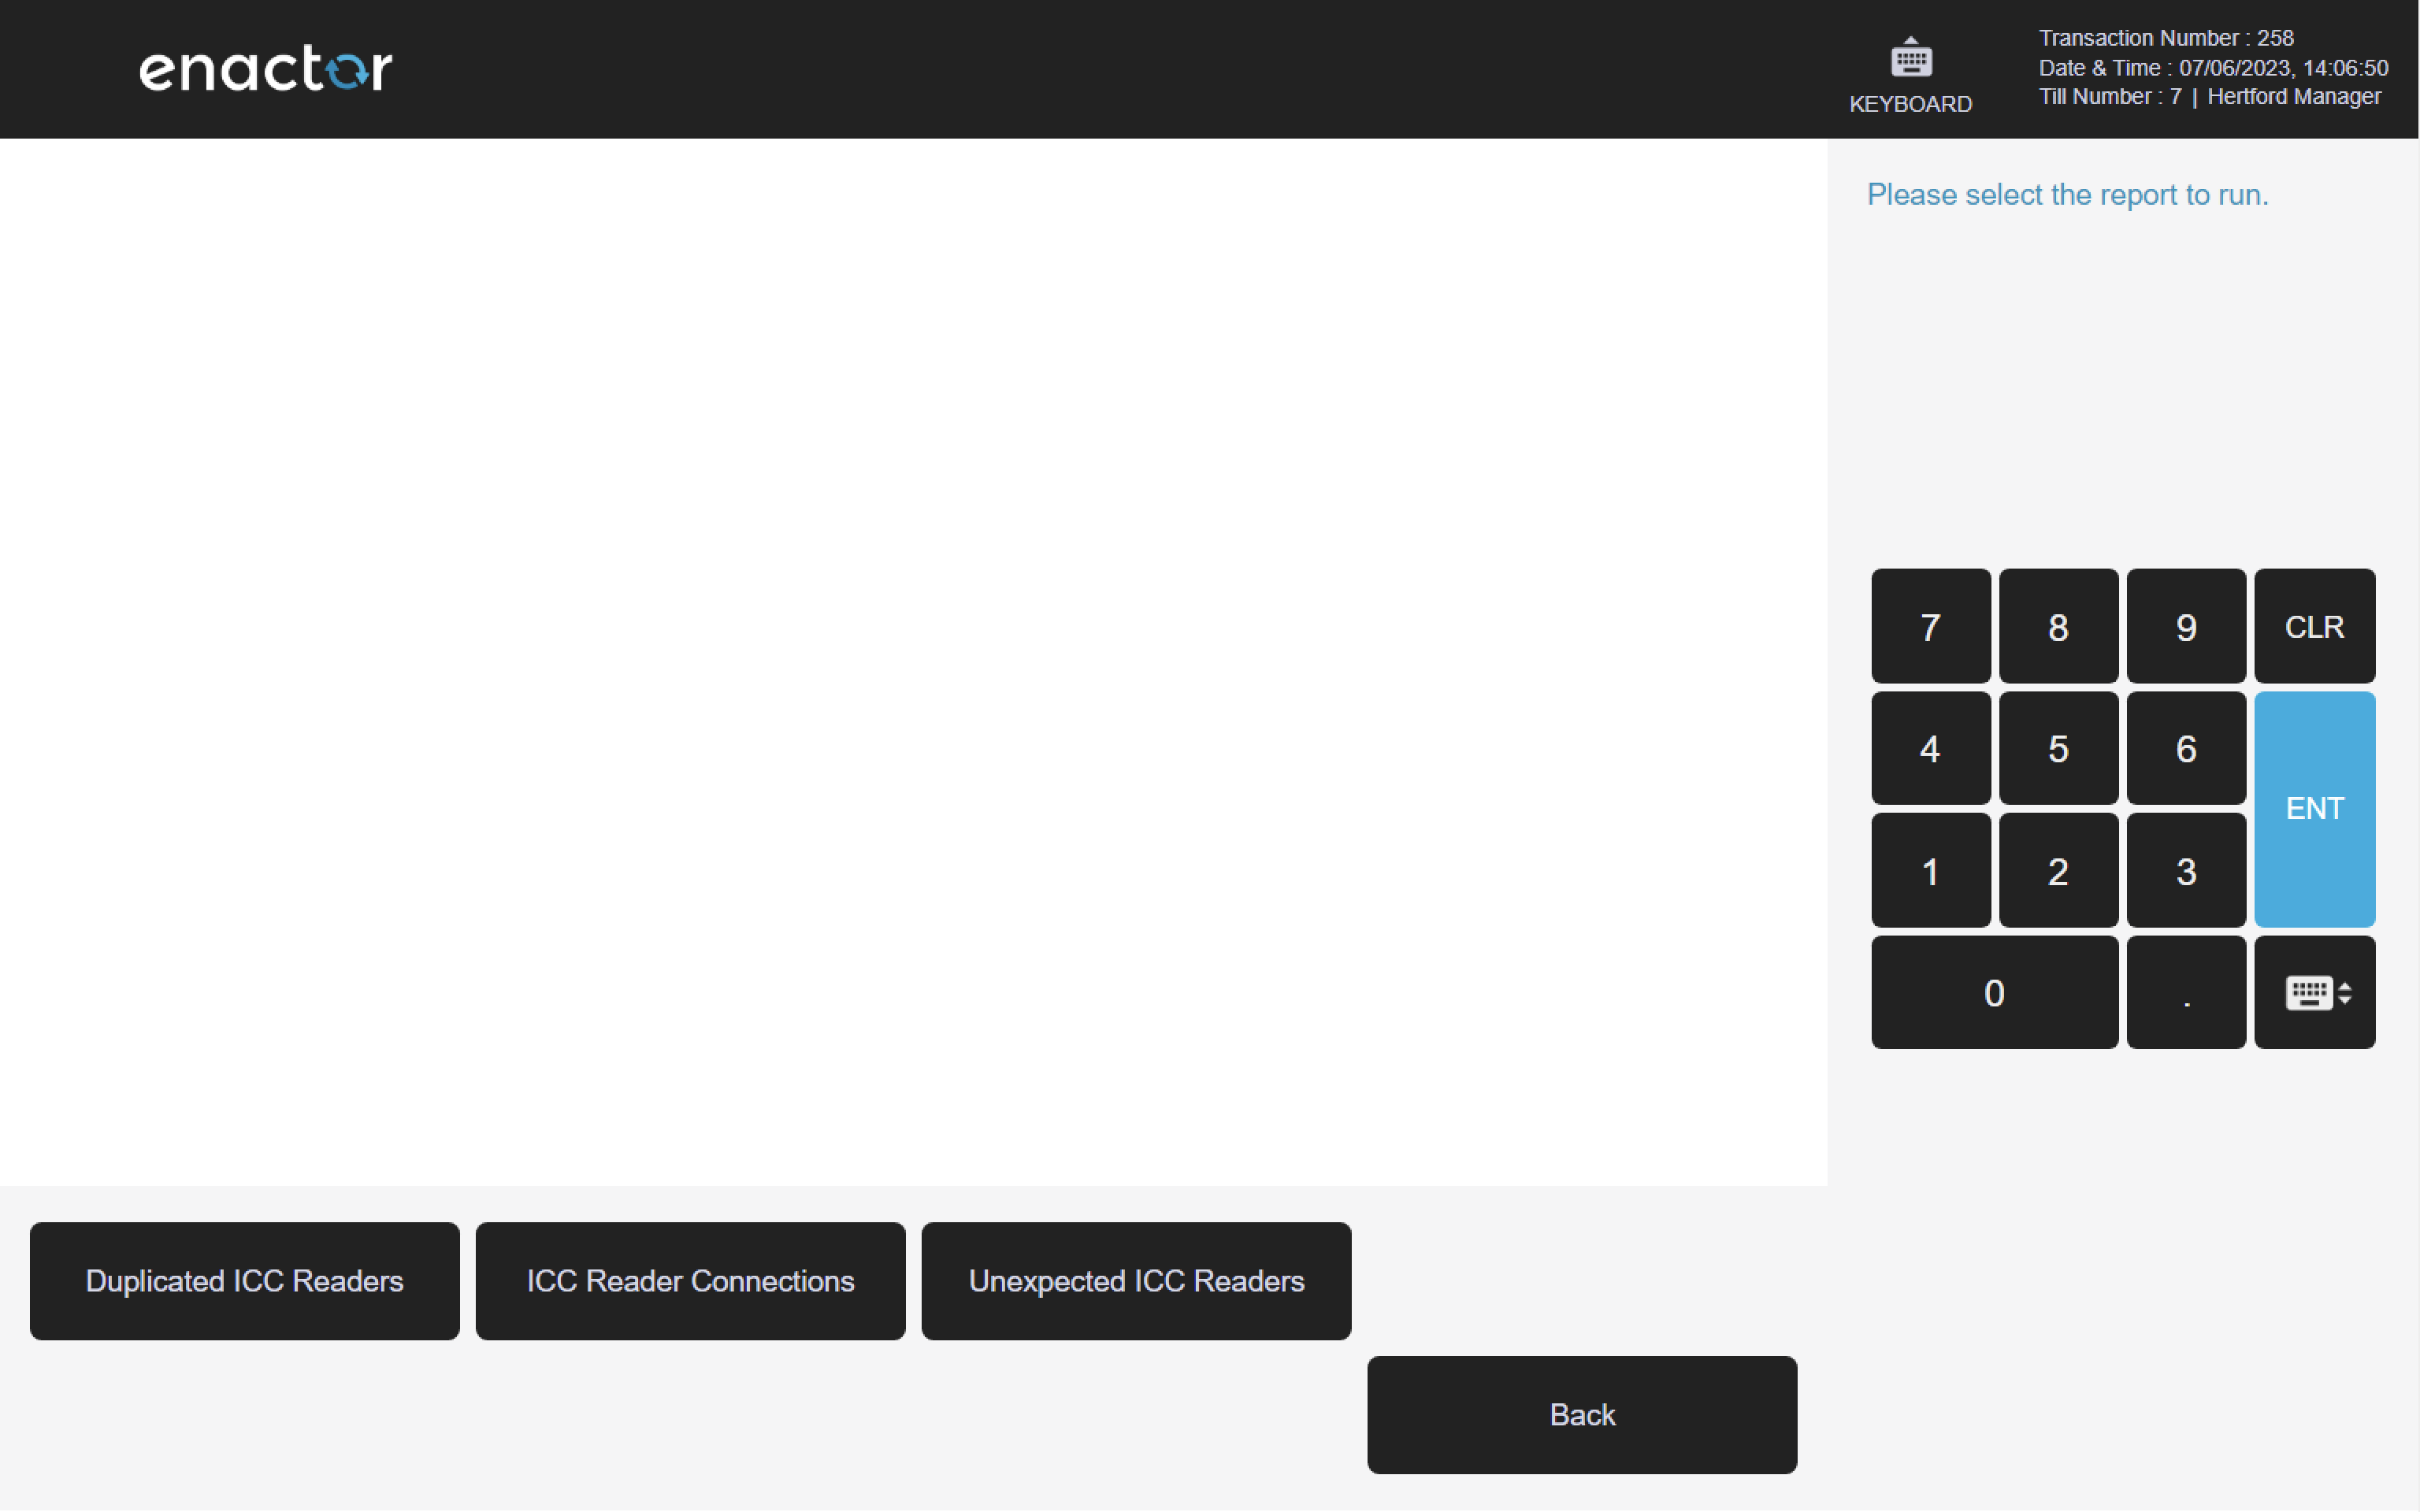
7.1 Duplicated ICC Readers
Path: ICC Reader Reports > Duplicated ICC Readers
View information about ICC readers whose serial numbers appear at more than one location or device.
Filter Criteria
| Property | Description |
|---|---|
| Region | Dropdown selection of available regions. |
| Location | Dropdown selection of locations, filtered by the selected region. |

Output Columns
| Property | Description |
|---|---|
| Serial Number | The serial number of the duplicated ICC reader. |
| Location | The location at which the ICC reader is registered. |
| Device | The device identifier to which the ICC reader is connected. |
| Host Name | The host name of the device to which the ICC reader is connected. |

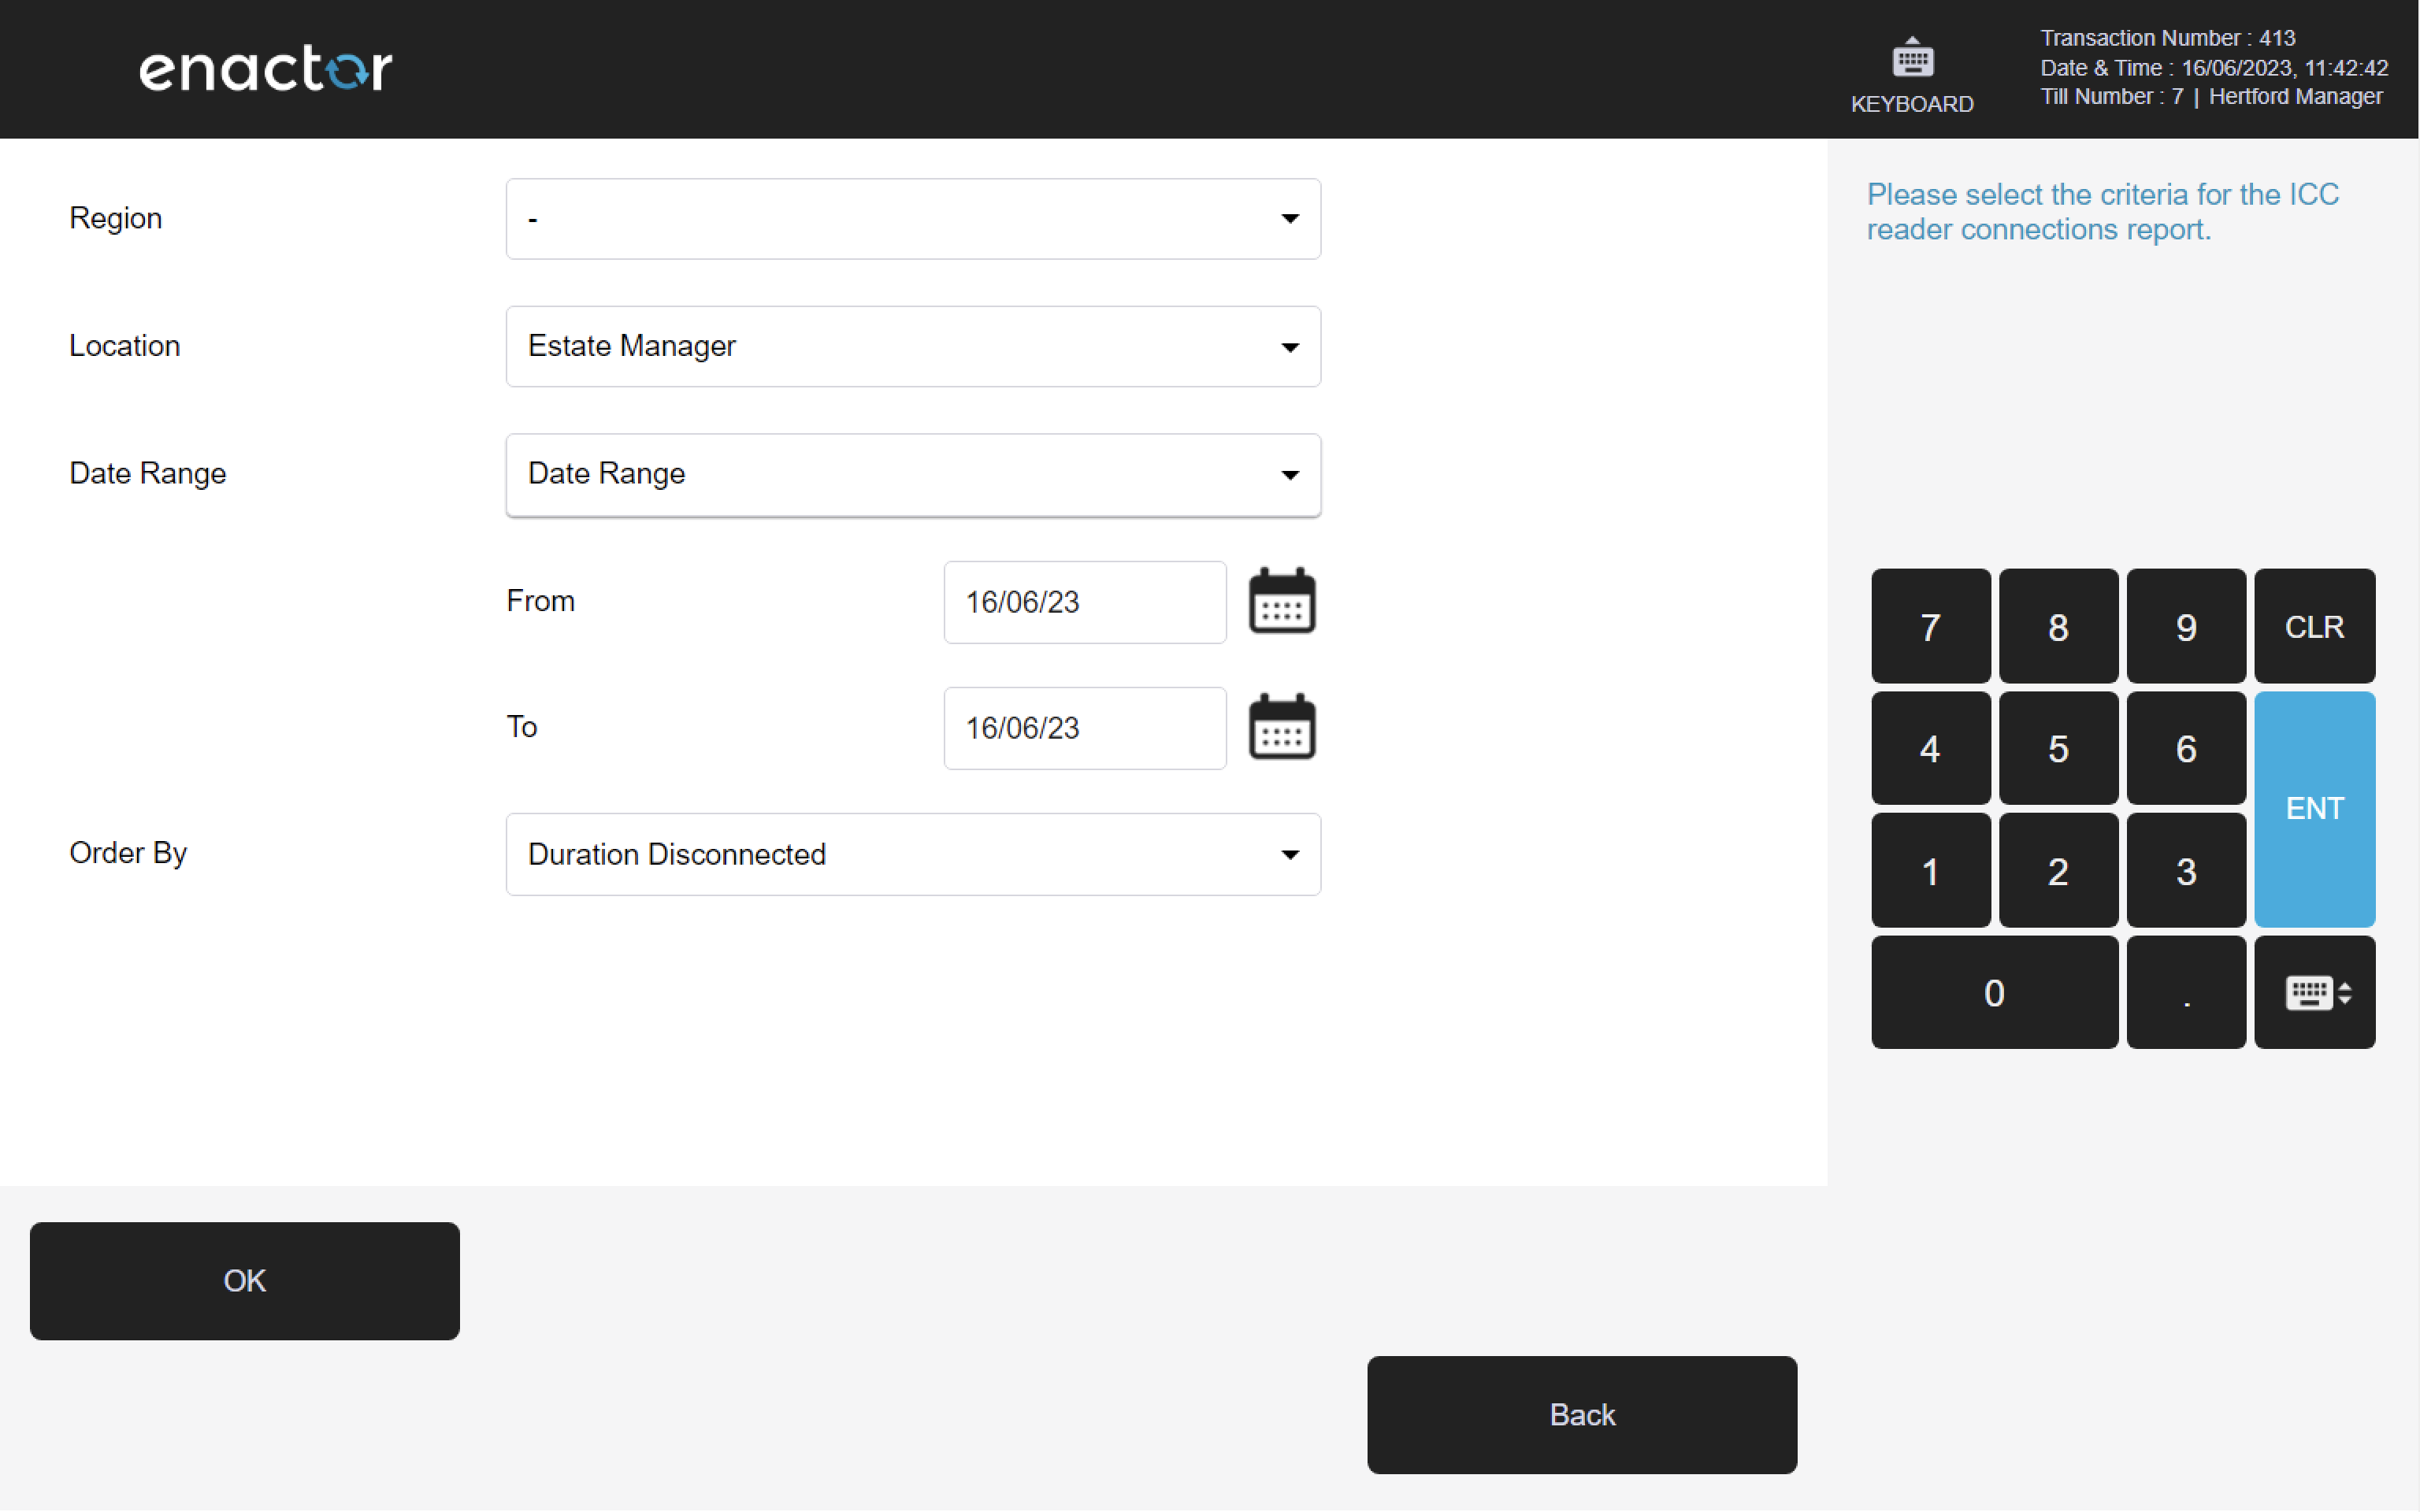
7.2 ICC Reader Connections
Path: ICC Reader Reports > ICC Reader Connections
View ICC reader connection information, including disconnect and reconnect events and the duration of disconnection.
Filter Criteria
| Property | Description |
|---|---|
| Region | Dropdown selection of available regions. |
| Location | Dropdown selection of locations, filtered by the selected region. |
| Date Range | Date range selector with from/to date inputs. |
| Order By | Dropdown to order results by Duration Disconnected or by Device ID. |
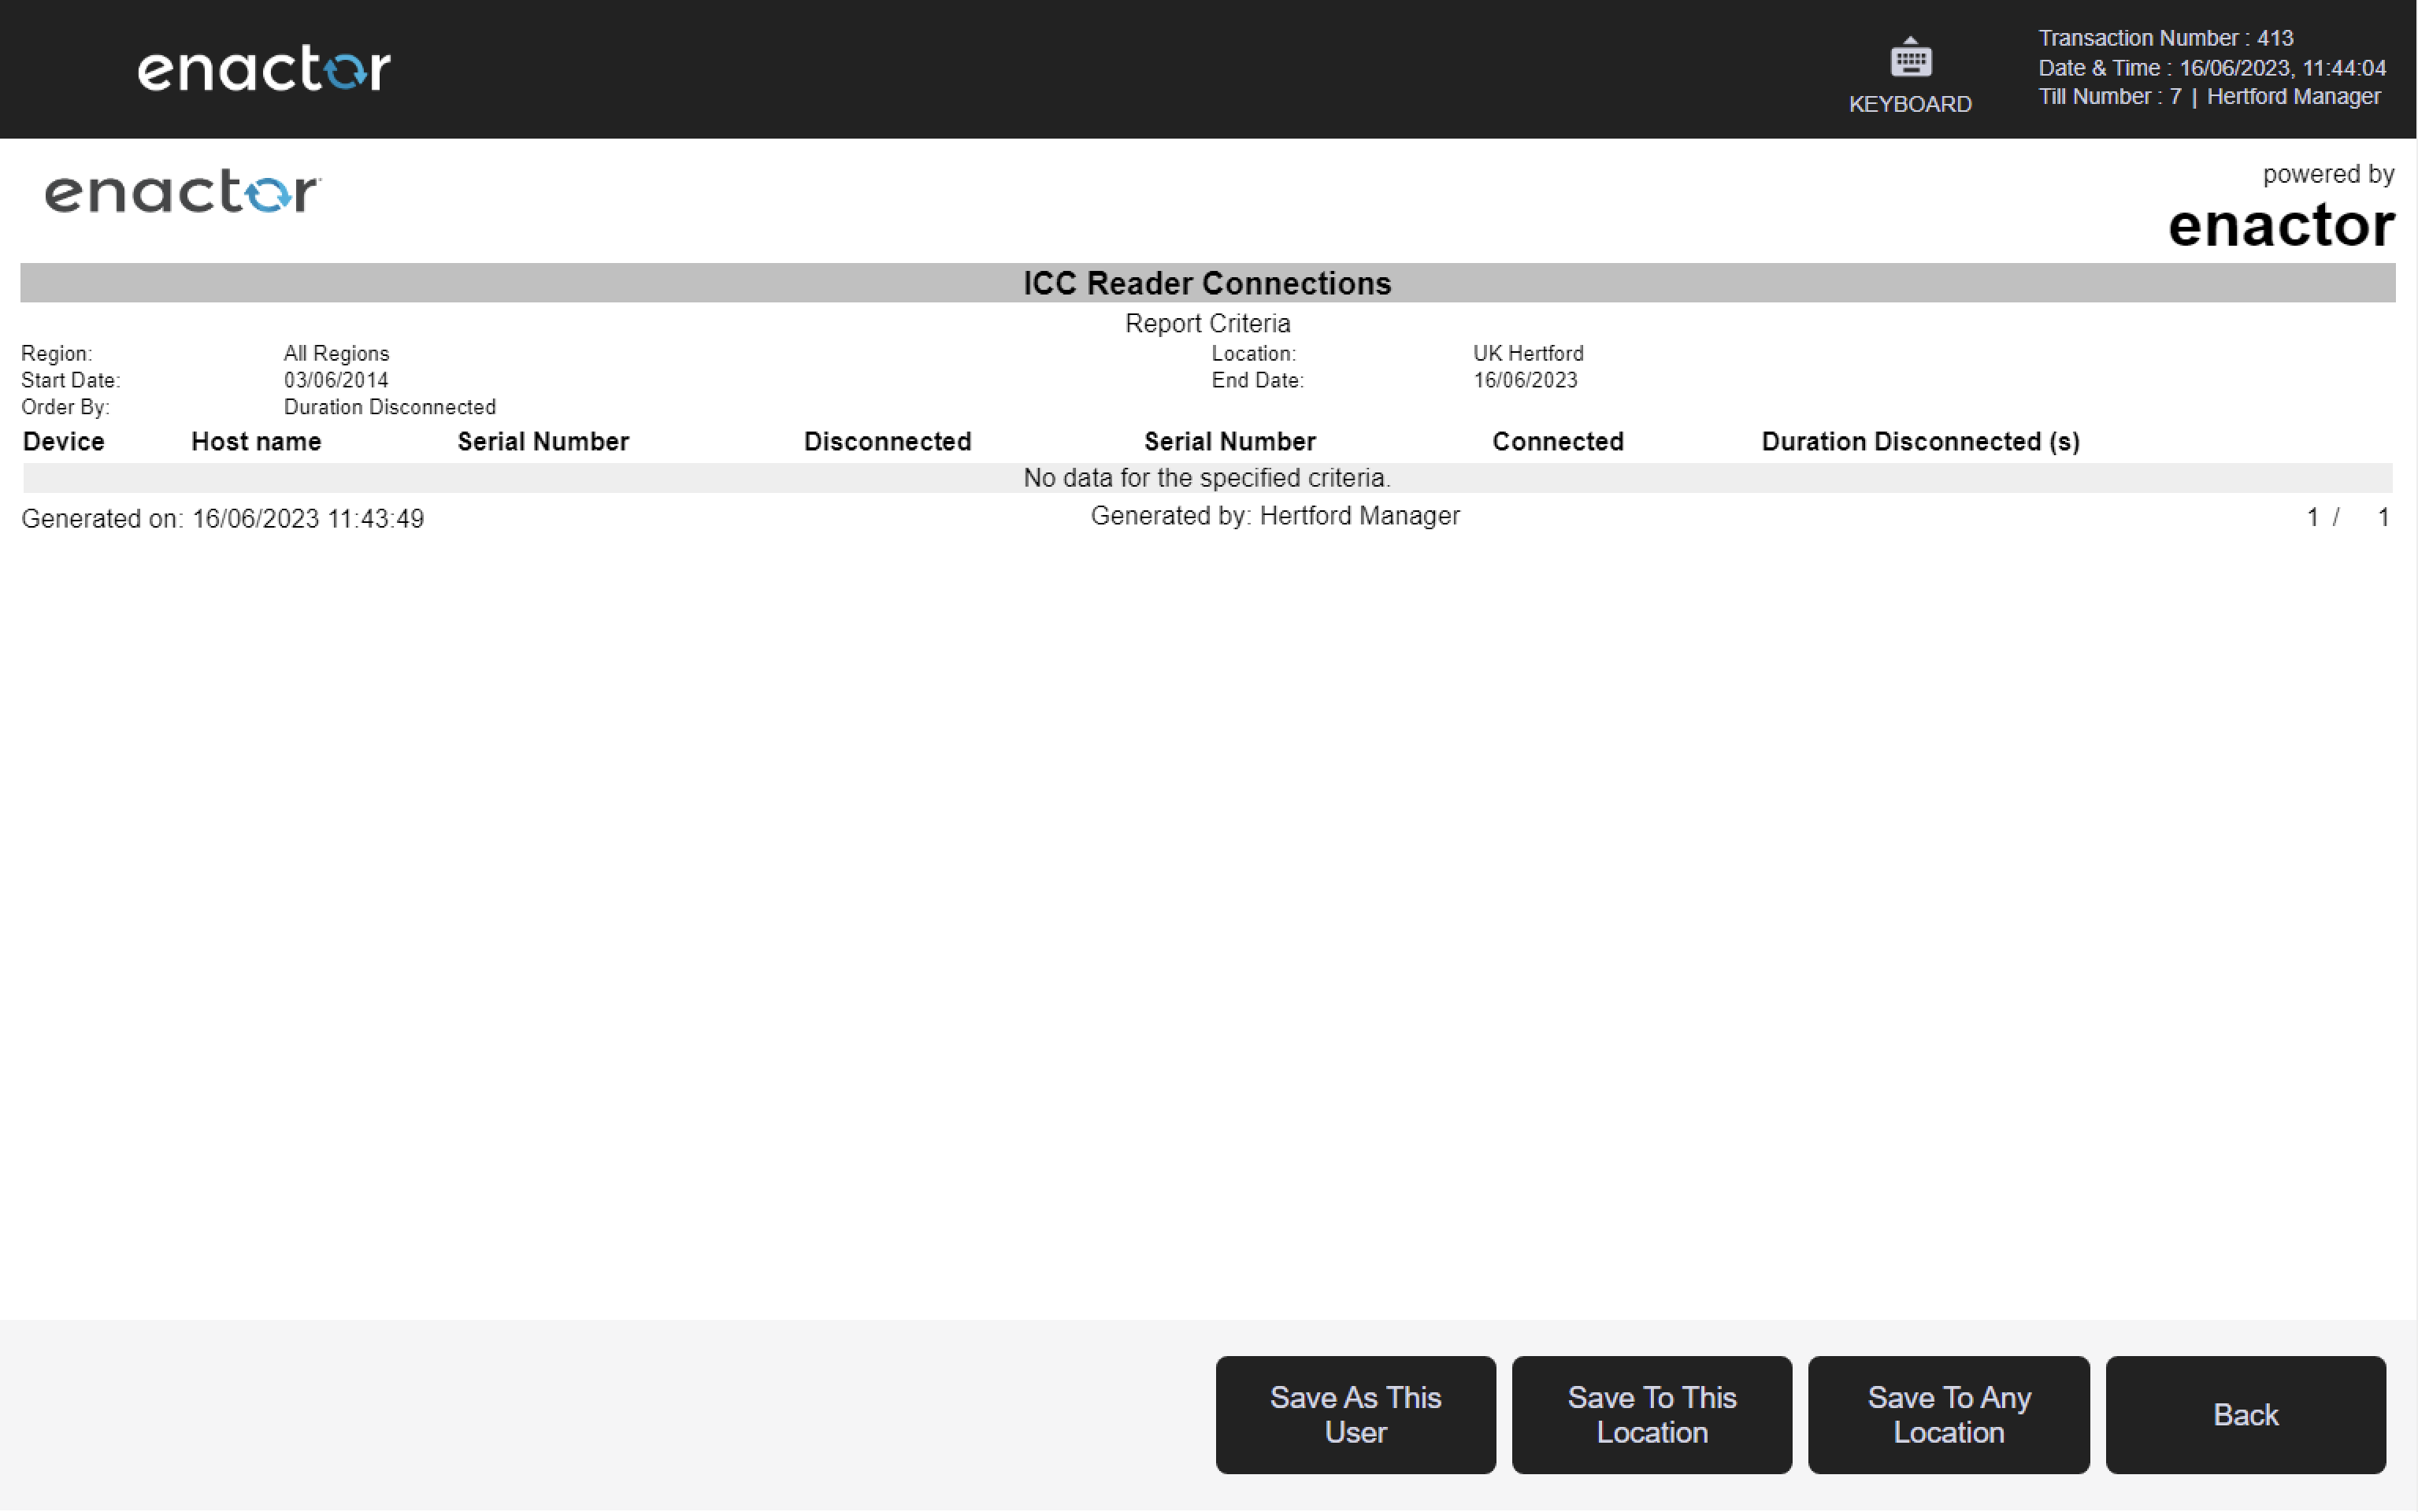
Output Columns
| Property | Description |
|---|---|
| Device | The device identifier associated with the connection event. |
| Host Name | The host name of the device. |
| Serial Number (disconnected) | The serial number of the ICC reader at the point of disconnection. |
| Disconnected | The date and time of the disconnection event. |
| Serial Number (connected) | The serial number of the ICC reader at the point of reconnection. |
| Connected | The date and time of the reconnection event. |
| Duration Disconnected (s) | The duration of the disconnection in seconds. |
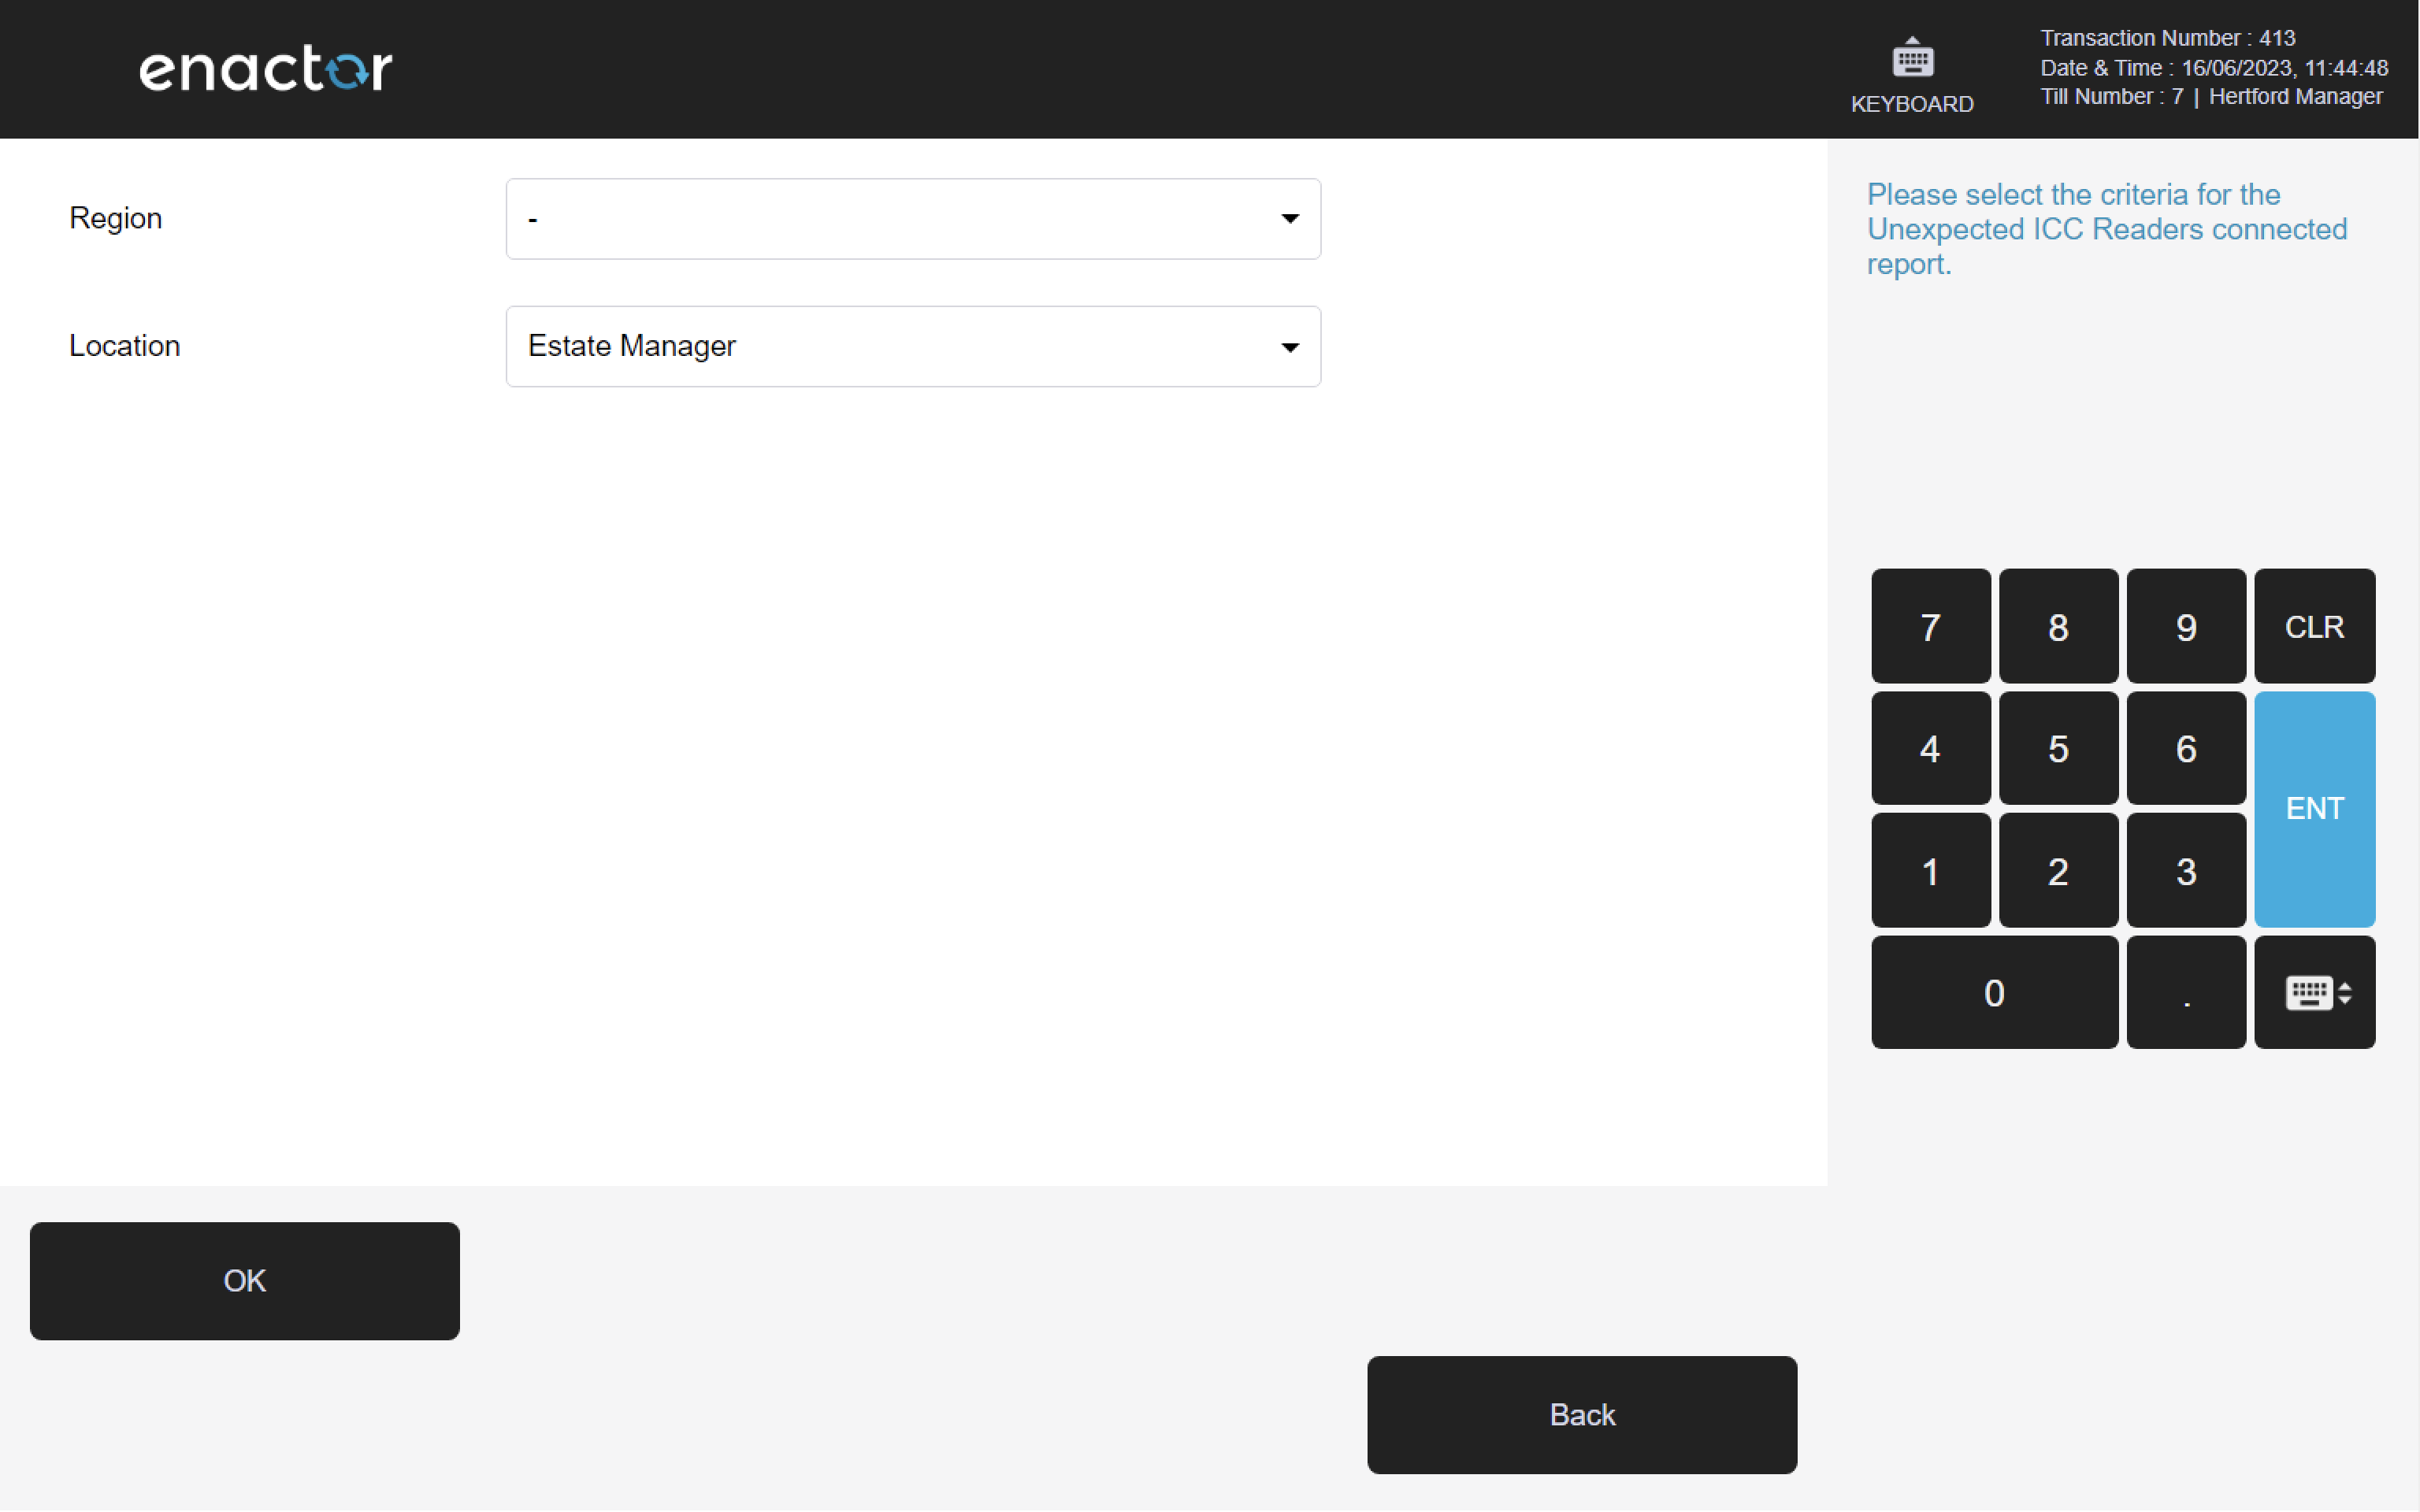
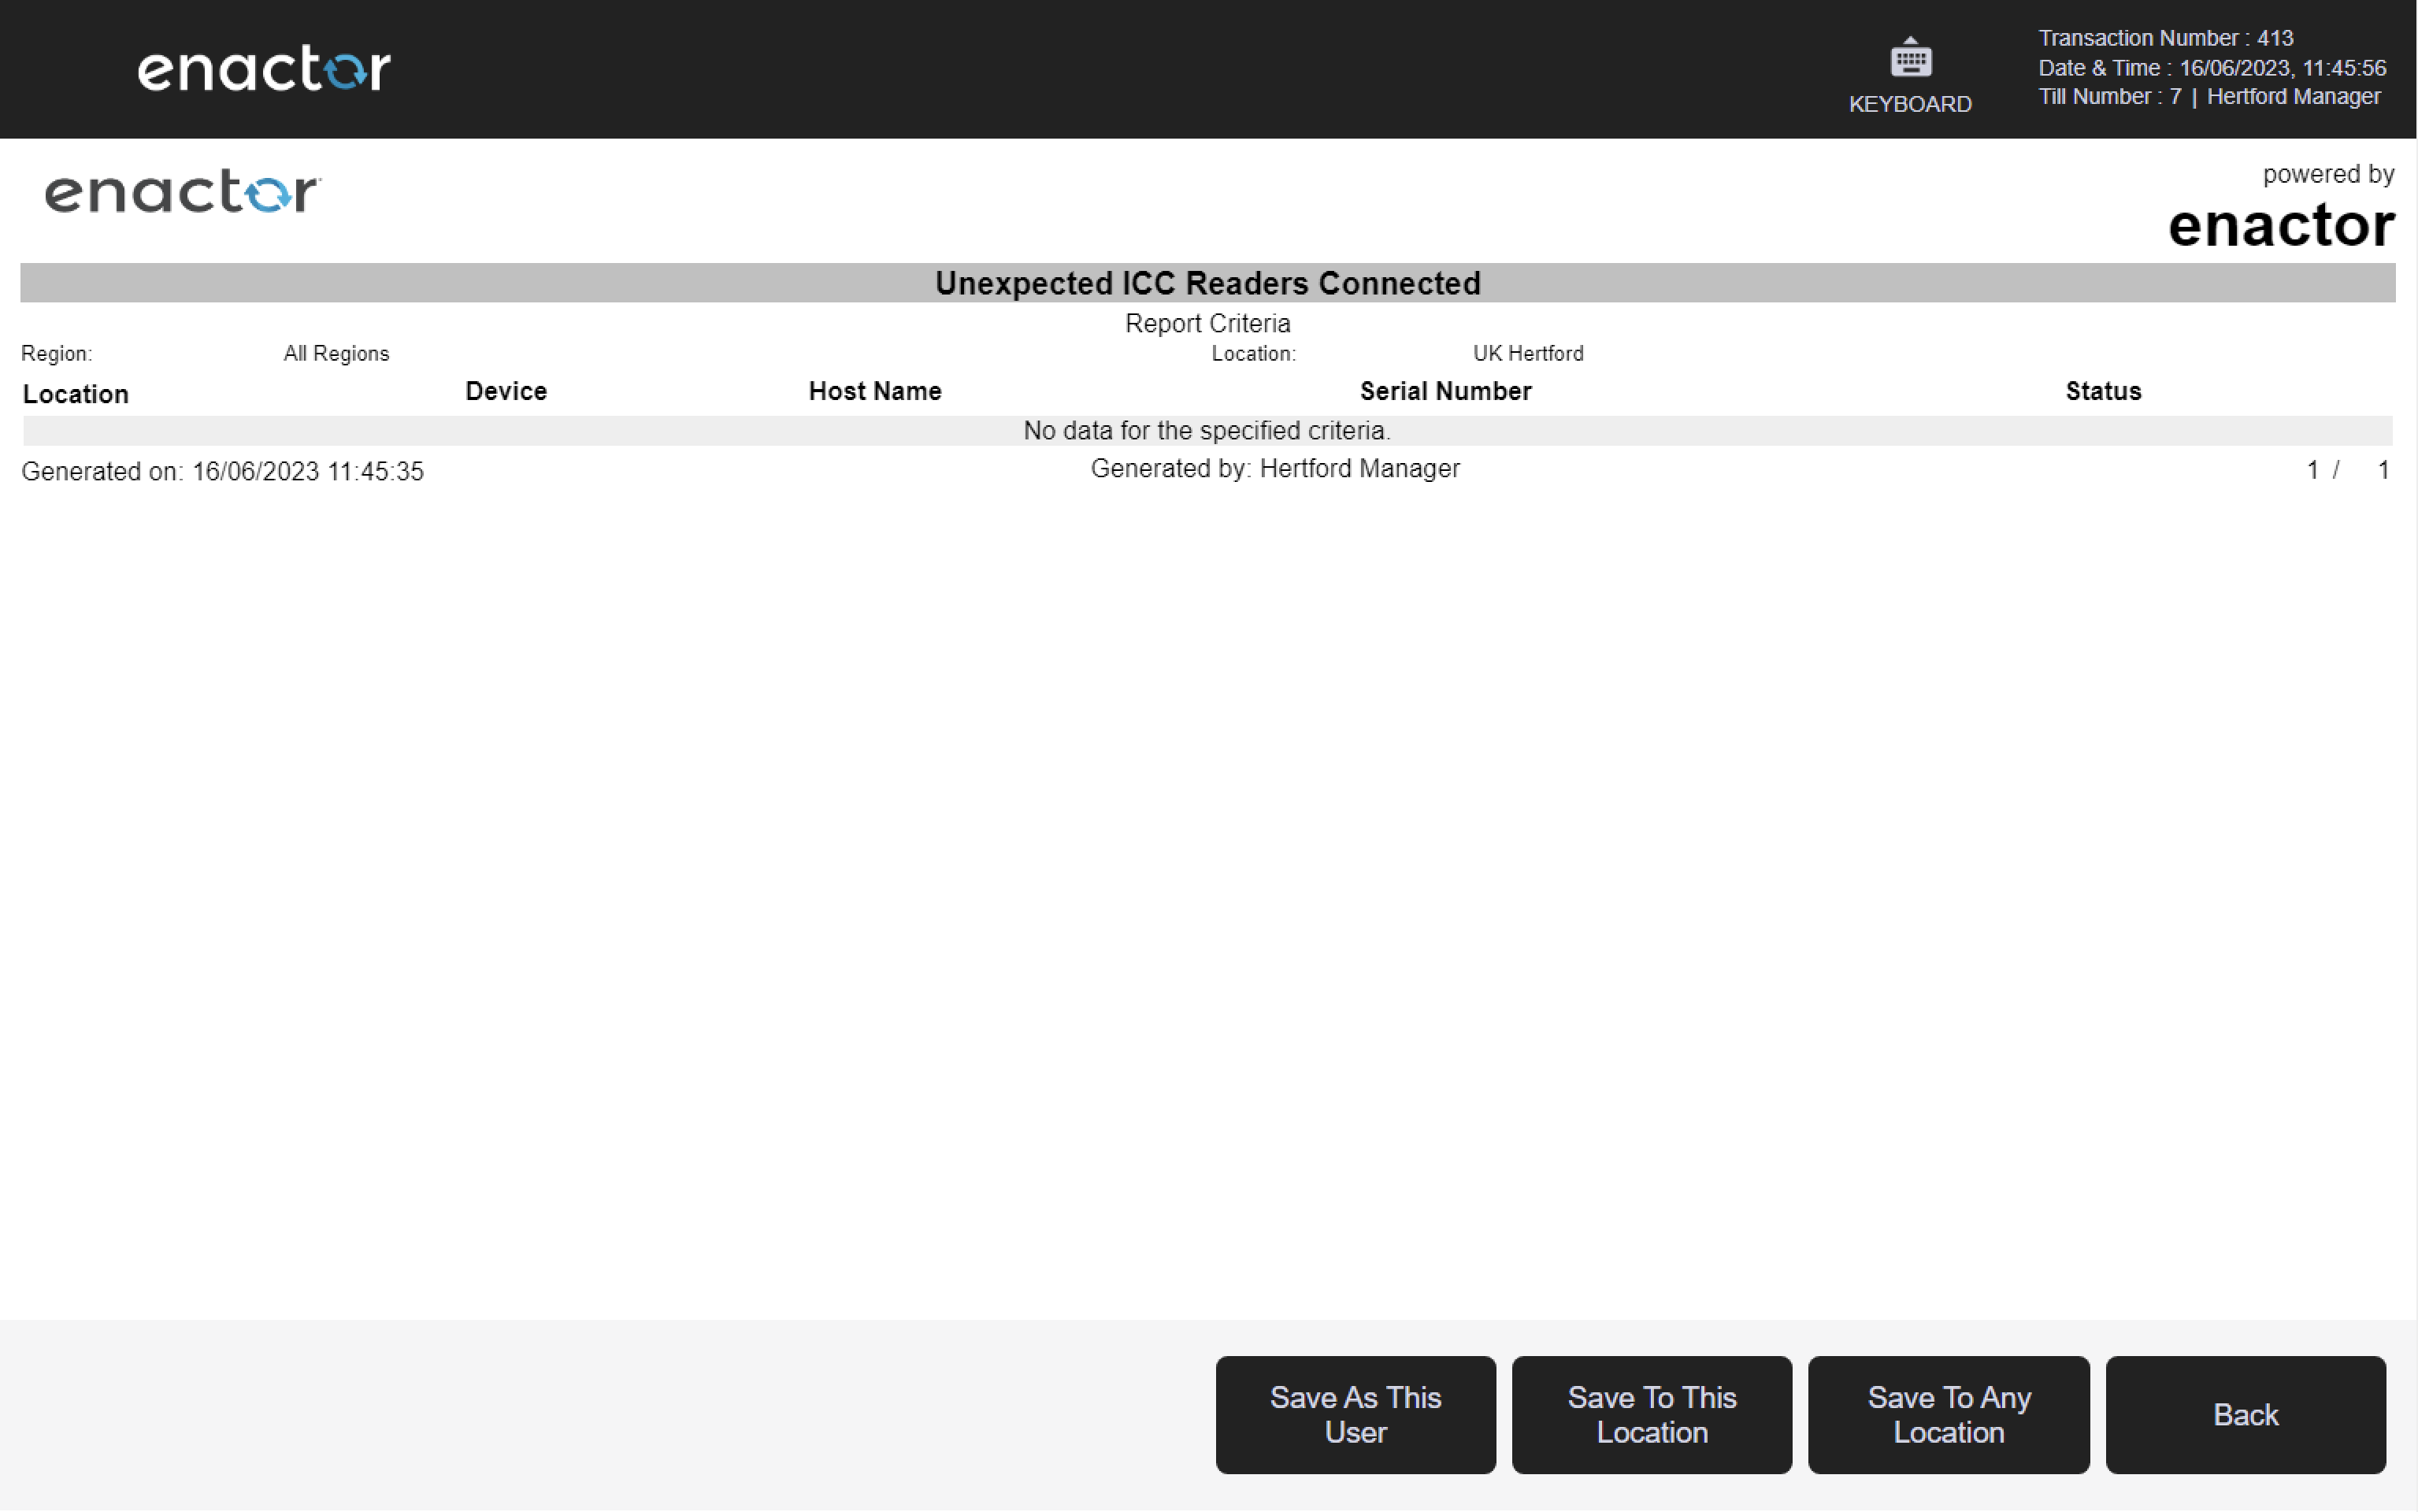
7.3 Unexpected ICC Readers
Path: ICC Reader Reports > Unexpected ICC Readers
View information about ICC readers that have been detected but are not expected at the identified location or device.
Filter Criteria
| Property | Description |
|---|---|
| Region | Dropdown selection of available regions. |
| Location | Dropdown selection of locations, filtered by the selected region. |
Output Columns
| Property | Description |
|---|---|
| Location | The location at which the unexpected ICC reader was detected. |
| Device | The device identifier to which the ICC reader is connected. |
| Host Name | The host name of the device. |
| Serial Number | The serial number of the unexpected ICC reader. |
| Status | The status of the ICC reader. Values include: Not On List, Repair, Decommissioned, Duplicate Serial Number, Not Connected Anywhere. |
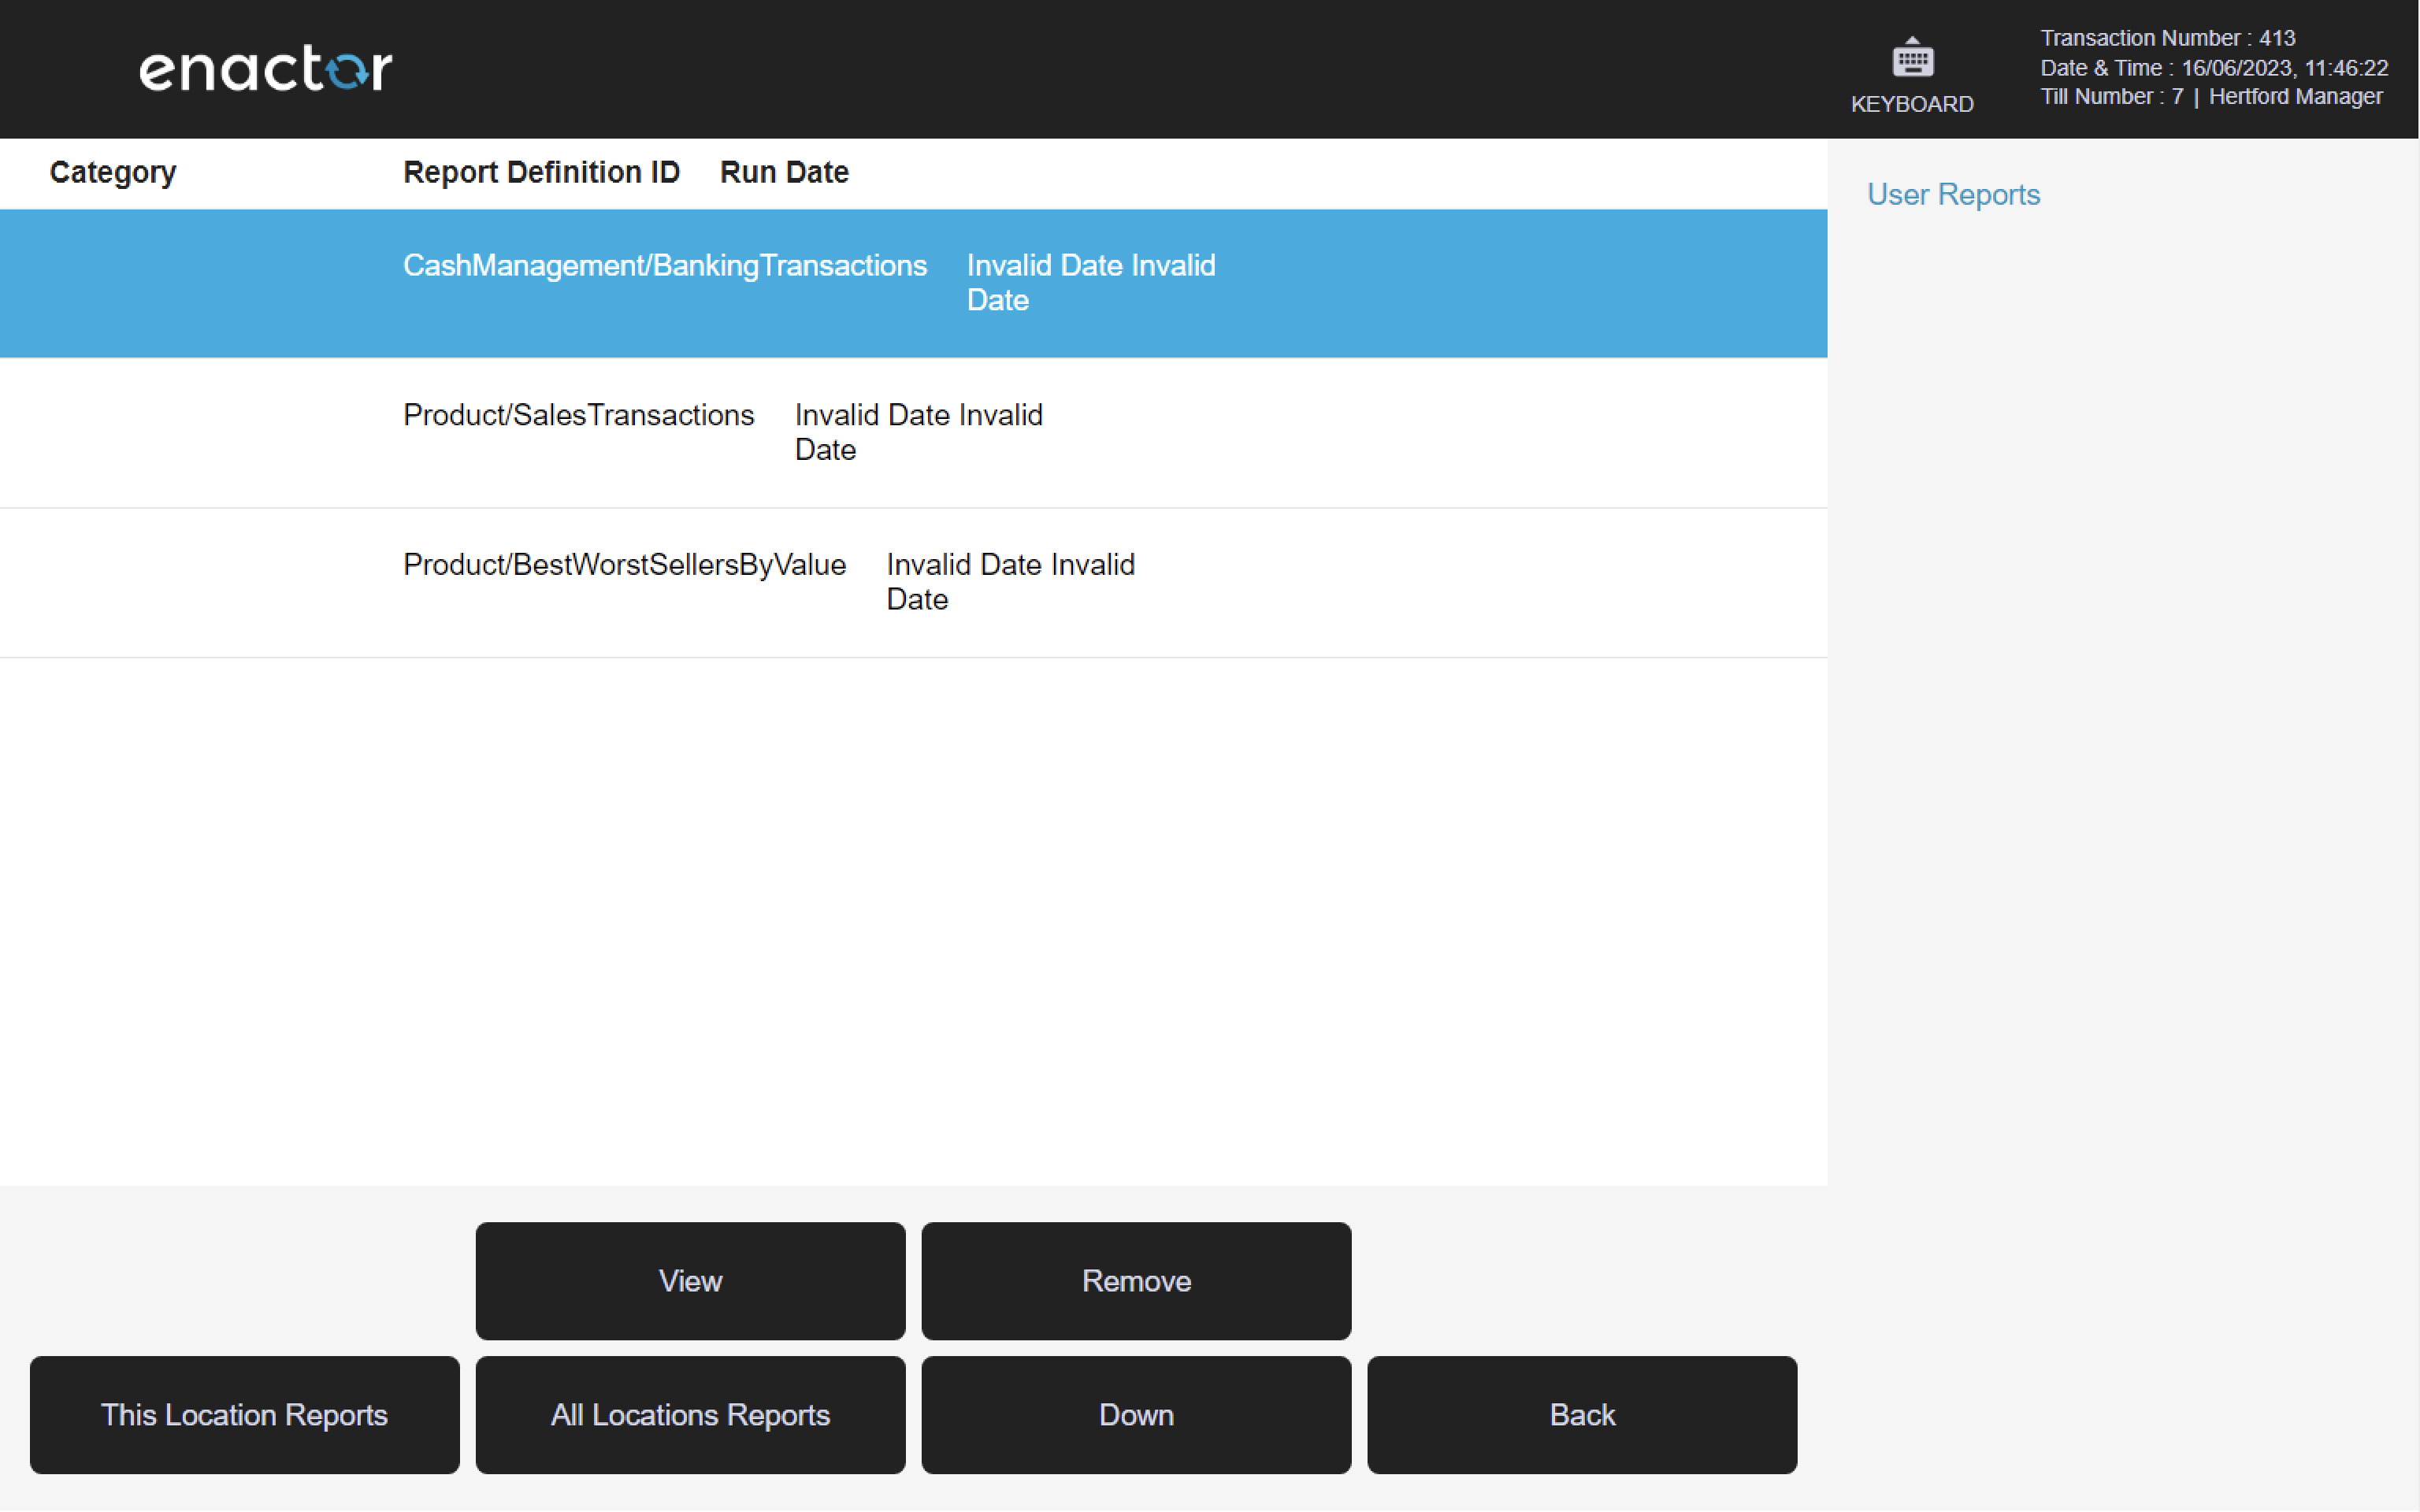
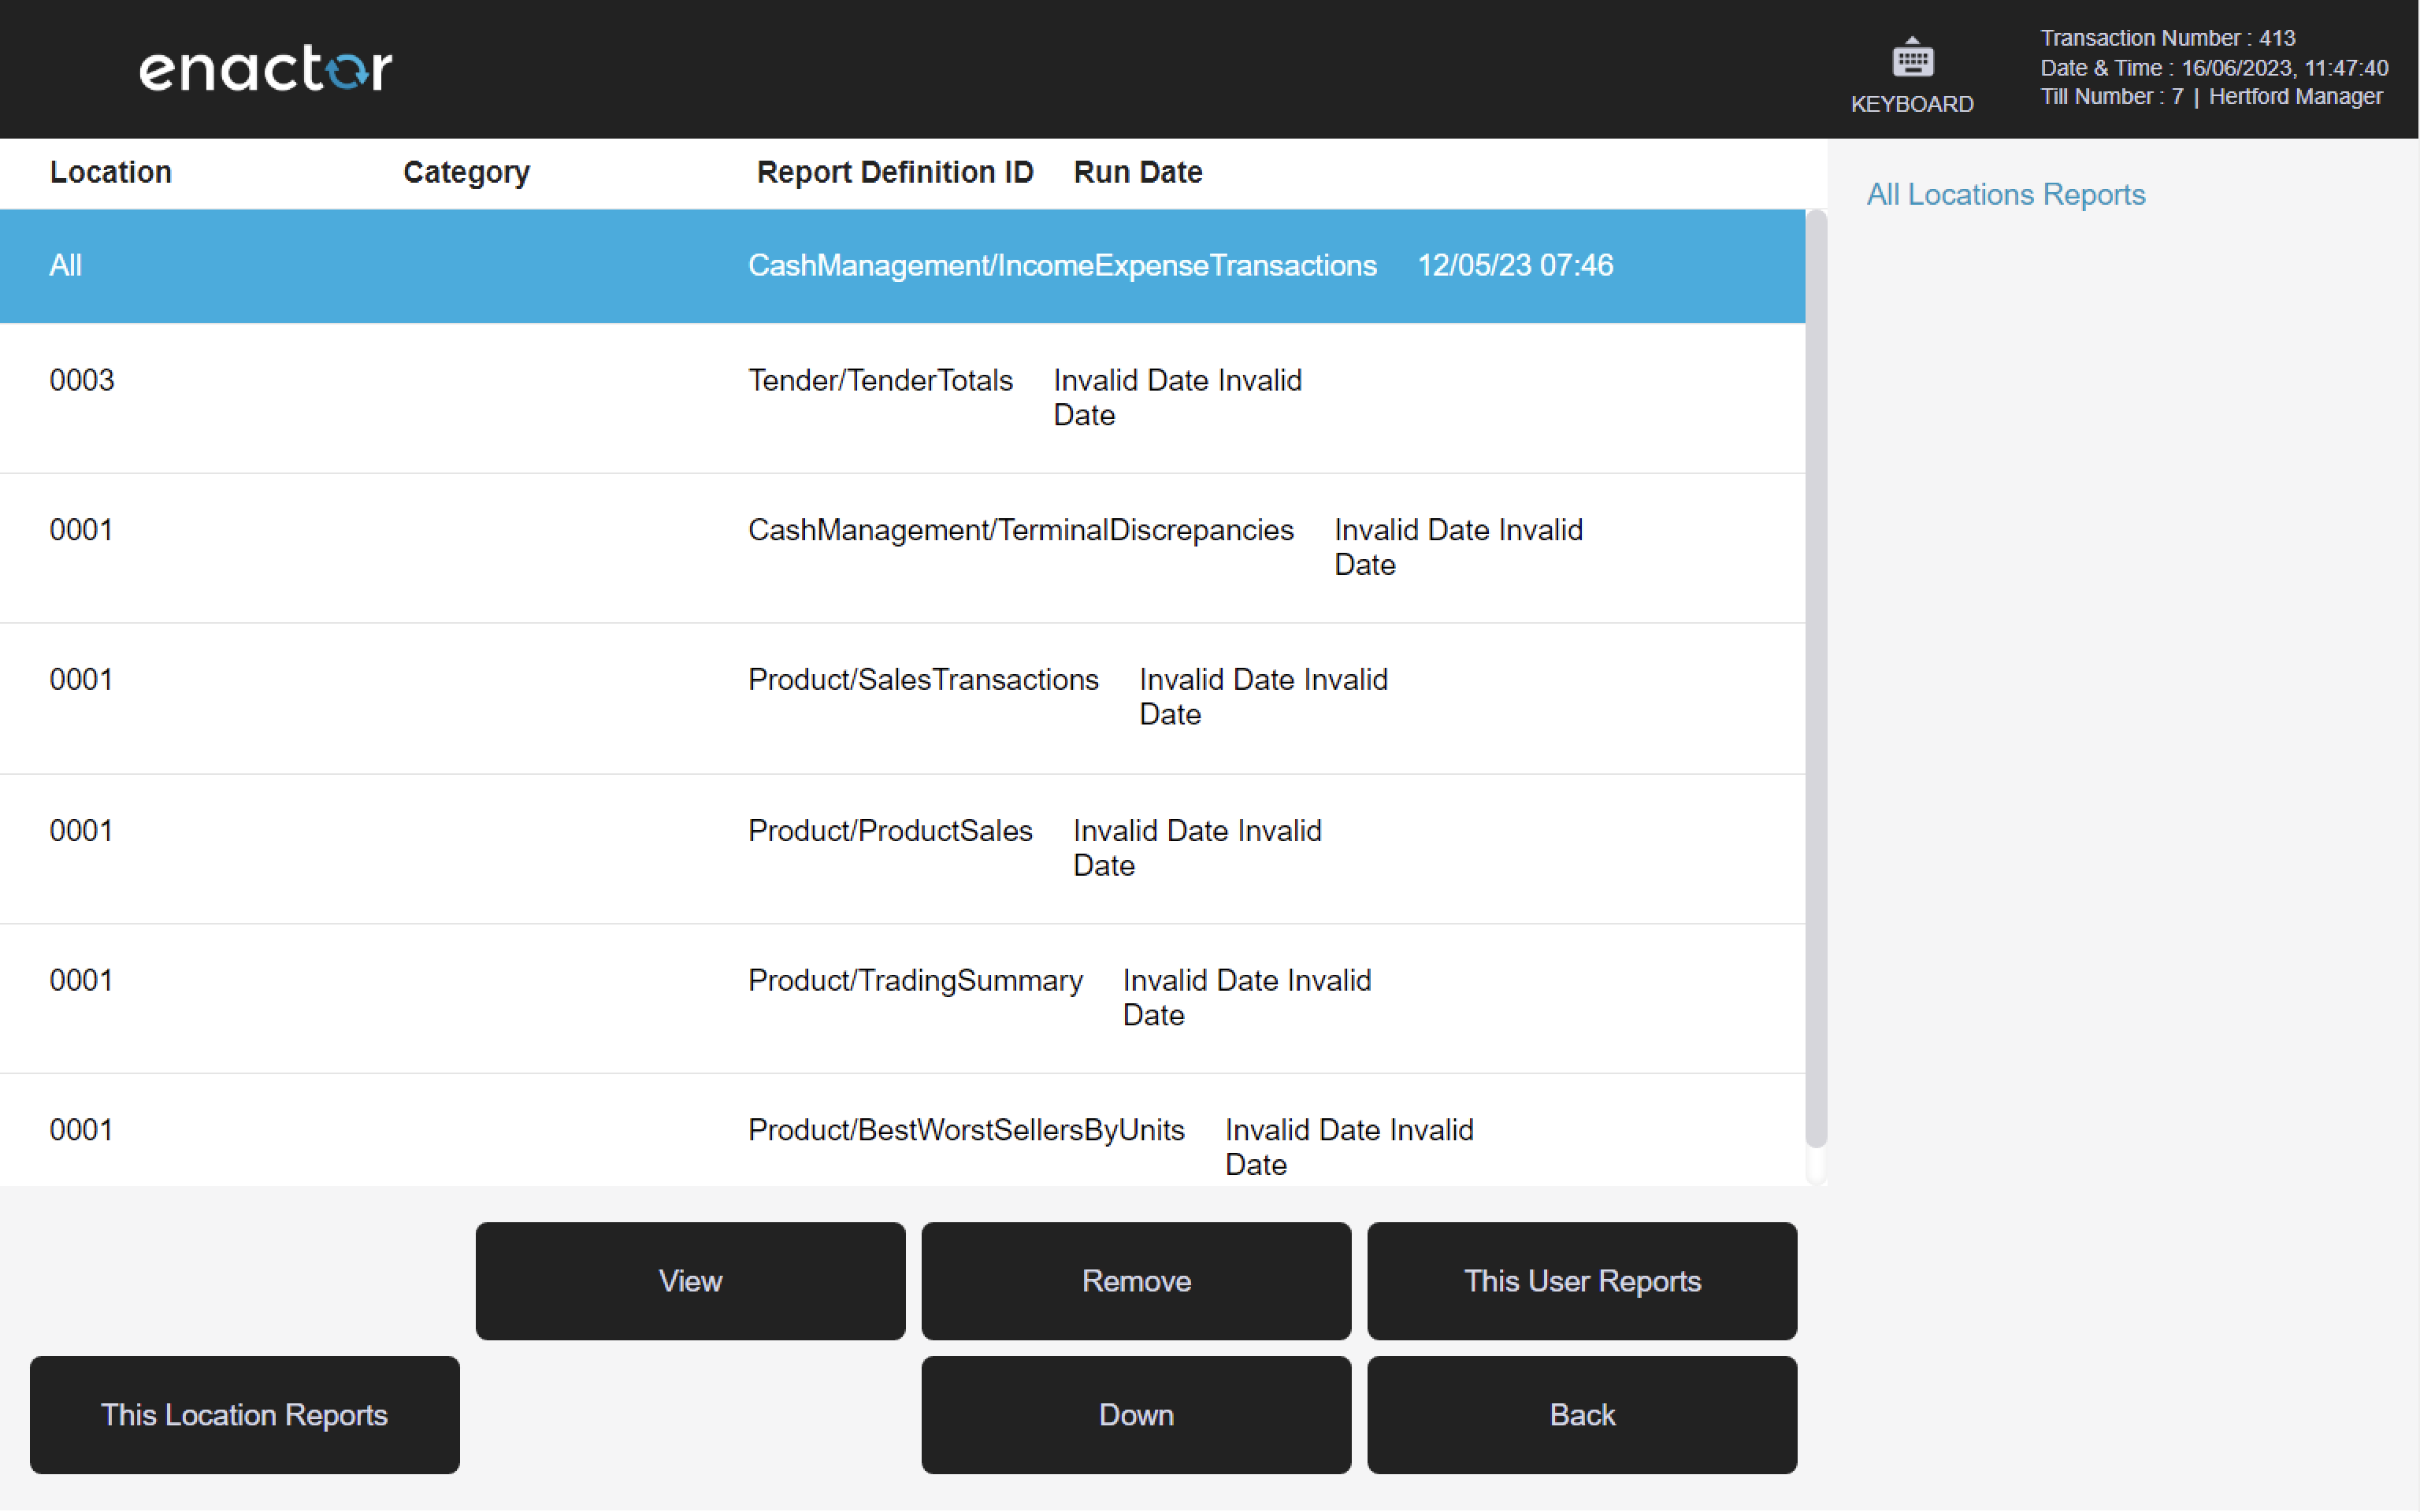
8 Saved Reports
Path: Web Reports > Saved Reports
Successfully generated reports can be stored and retrieved using the Saved Reports viewer. From this viewer, saved reports can be viewed, saved to file, removed, and printed.

About This Document
©2023 Enactor Ltd
Document Version: 1 Product Version: 2.7 Contact: documentation@enactor.co.uk