How To EM Product Reports
Introduction
The Enactor application provides a range of Product Reports to support operational insight into product-related activities. These built-in reports are accessed through the Estate Manager and cover sales performance, replenishment activity, returns, price changes, and stock analysis.
The purpose of this guide is to demonstrate how to navigate to, filter, and interpret each of the Product Reports available in the Estate Manager. The integrated reports can be enhanced by custom reports produced by the retailer, which can be incorporated into the Reports User Interface.
Both the built-in and custom reports are presented in a standard User Interface, which typically includes the capture of report parameters before generating the report.
Overview
The following Product Reports are covered in this guide:
- Best / Worst Sellers by Units Report - Tabulates best and worst selling products by the number of units sold
- Best / Worst Sellers by Value Report - Tabulates best and worst selling products by the value of sales
- Best / Worst Selling Styles by Units Report - Tabulates best and worst selling styles by the number of units sold
- Best / Worst Selling Styles by Value Report - Tabulates best and worst selling styles by the value of sales
- MMG Summary Pie Chart - Displays MMG Summary information in pie chart form
- MMG Summary - Tabulates sales details based on the MMG Level defined at report criteria
- Price Changes - Tabulates details of price changes done during a specified period of time
- Product Sales - Tabulates product sales by the number of units sold
- Replenishments - Displays replenishment information according to specified criteria
- Returns - Displays return information according to set criteria
- Rolling Replenishment Stock Ledger Transactions - Tabulates stock ledger transaction details
Additional reports are available in the Product Reports category but are not covered in this guide: Rolling Replenishment, Sales Tax, Sales Transactions, Stock Valuation, and Trading Summary.
Product Reports
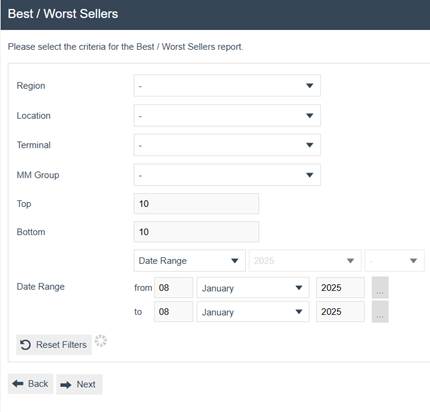
Best / Worst Sellers by Units Report
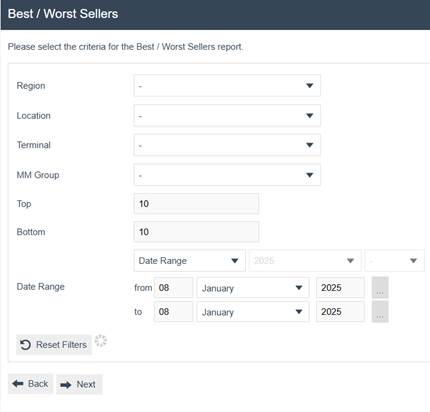
The Best / Worst Sellers by Units Report tabulates the best and worst selling products by the number of units sold. Users can filter results by region, location, terminal, merchandise group, and date range.
Navigate to the Best / Worst Sellers by Units Report using the Search or the path: Reports > Product Reports > Best / Worst Sellers by Units

Filter Criteria
Use the filter criteria to narrow the reporting data before generating the report.
| Filter Criteria | Description |
|---|---|
| Region | Dropdown list selection of configured Regions. |
| Location | Dropdown list selection of configured Locations in the selected Region. If no Region is specified, all Locations configured are shown. |
| Terminal | Dropdown selection from a list of all Terminals configured at the selected Location. If no Location is specified, all Terminals configured are shown. |
| MM Group | Dropdown list selection of defined MM Groups. |
| Top | Numeric value indicating the number of best sellers to display. The default value is 10. |
| Bottom | Numeric value indicating the number of worst sellers to display. The default value is 10. |
| Date Range | The date range required to generate the report. |
Press Back to return to the previous screen. Press Next to create a scheduled job to run the report. Press Reset Filters to clear all selections.
Wait For Report
When a report is submitted, the system displays a progress screen indicating the report is in a queue. Several self-explanatory messages can appear at this point with options to Cancel, Don't Wait, or Refresh.

| Button | Description |
|---|---|
| Cancel | Cancels the report job. |
| Don't Wait | Allows the user to continue working. The report will be available from saved reports when complete. |
| Refresh | Refreshes the report status if it seems to be taking a long time to display. |
Report Summary
Once the report has been generated, the summary screen displays the filter criteria in the header and the transaction details below.
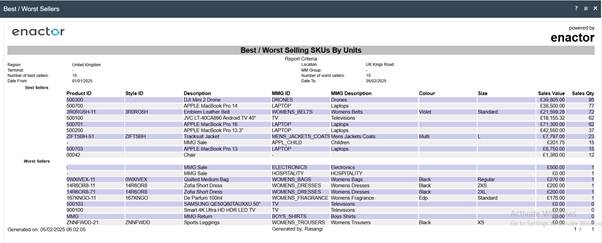
The report output toolbar provides additional export options. Use Print, View PDF, Save XLS, or Save DOC to export the report in the required format.

| Button | Description |
|---|---|
| Back | Returns the user to the previous screen. |
| Sends a copy of the report to an attached printer. | |
| View PDF | Enables the user to view the report in PDF format. |
| Save XLS | Saves the report in Excel spreadsheet format. |
| Save DOC | Saves the report in Word format. |
This completes the Best / Worst Sellers by Units Report.
Best / Worst Sellers by Value Report
The Best / Worst Sellers by Value Report tabulates the best and worst selling products by the value of sales. Users can filter results by region, location, terminal, merchandise group, and date range.
Navigate to the Best / Worst Sellers by Value Report using the Search or the path: Reports > Product Reports > Best / Worst Sellers by Value

Filter Criteria

| Filter Criteria | Description |
|---|---|
| Region | Dropdown list selection of configured Regions. |
| Location | Dropdown list selection of configured Locations in the selected Region. If no Region is specified, all Locations configured are shown. |
| Terminal | Dropdown selection from a list of all Terminals at the selected Location. If no Location is specified, all Terminals configured are shown. |
| MM Group | Dropdown list selection of defined MM Groups. |
| Top | Numeric value indicating the number of best sellers to display. The default value is 10. |
| Bottom | Numeric value indicating the number of worst sellers to display. The default value is 10. |
| Date Range | The date range required to generate the report. |
Press Back to return to the previous screen. Press Next to create a scheduled job to run the report. Press Reset Filters to clear all selections.
Wait For Report
When a report is submitted, the system displays a progress screen indicating the report is in a queue. Several self-explanatory messages can appear at this point with options to Cancel, Don't Wait, or Refresh.
| Button | Description |
|---|---|
| Cancel | Cancels the report job. |
| Don't Wait | Allows the user to continue working. The report will be available from saved reports when complete. |
| Refresh | Refreshes the report status if it seems to be taking a long time to display. |
Report Summary
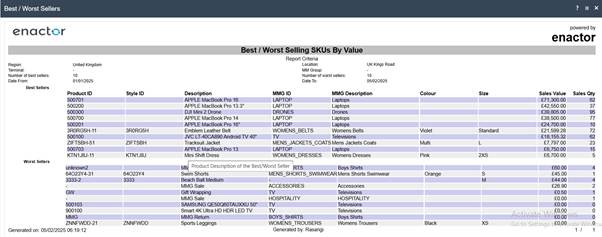
This completes the Best / Worst Sellers by Value Report.
Best / Worst Selling Styles by Units Report
The Best / Worst Selling Styles by Units Report tabulates the best and worst selling styles by the number of units sold. This report groups products by style rather than individual SKU.
Navigate to the Best / Worst Selling Styles by Units Report using the Search or the path: Reports > Product Reports > Best / Worst Selling Styles by Units

Filter Criteria

| Filter Criteria | Description |
|---|---|
| Region | Dropdown list selection of configured Regions. |
| Location | Dropdown list selection of configured Locations in the selected Region. If no Region is specified, all Locations configured are shown. |
| Terminal | Dropdown selection from a list of all Terminals at the selected Location. If no Location is specified, all Terminals configured are shown. |
| MM Group | Dropdown list selection of defined MM Groups. |
| Top | Numeric value indicating the number of best sellers to display. The default value is 10. |
| Bottom | Numeric value indicating the number of worst sellers to display. The default value is 10. |
| Date Range | The date range required to generate the report. |
Press Back to return to the previous screen. Press Next to create a scheduled job to run the report. Press Reset Filters to clear all selections.
Wait For Report
When a report is submitted, the system displays a progress screen indicating the report is in a queue. Several self-explanatory messages can appear at this point with options to Cancel, Don't Wait, or Refresh.
| Button | Description |
|---|---|
| Cancel | Cancels the report job. |
| Don't Wait | Allows the user to continue working. The report will be available from saved reports when complete. |
| Refresh | Refreshes the report status if it seems to be taking a long time to display. |
Report Summary

This completes the Best / Worst Selling Styles by Units Report.
Best / Worst Selling Styles by Value Report
The Best / Worst Selling Styles by Value Report tabulates the best and worst selling styles by the value of sales. This report groups products by style and ranks them by sales value.
Navigate to the Best / Worst Selling Styles by Value Report using the Search or the path: Reports > Product Reports > Best / Worst Selling Styles by Value

Filter Criteria

| Filter Criteria | Description |
|---|---|
| Region | Dropdown list selection of configured Regions. |
| Location | Dropdown list selection of configured Locations in the selected Region. If no Region is specified, all Locations configured are shown. |
| Terminal | Dropdown selection from a list of all Terminals configured at the selected Location. If no Location is specified, all Terminals configured are shown. |
| MM Group | Dropdown list selection of defined MM Groups. |
| Top | Numeric value indicating the number of best sellers to display. The default value is 10. |
| Bottom | Numeric value indicating the number of worst sellers to display. The default value is 10. |
| Date Range | The date range required to generate the report. |
Press Back to return to the previous screen. Press Next to create a scheduled job to run the report. Press Reset Filters to clear all selections.
Wait For Report
When a report is submitted, the system displays a progress screen indicating the report is in a queue. Several self-explanatory messages can appear at this point with options to Cancel, Don't Wait, or Refresh.
| Button | Description |
|---|---|
| Cancel | Cancels the report job. |
| Don't Wait | Allows the user to continue working. The report will be available from saved reports when complete. |
| Refresh | Refreshes the report status if it seems to be taking a long time to display. |
Report Summary
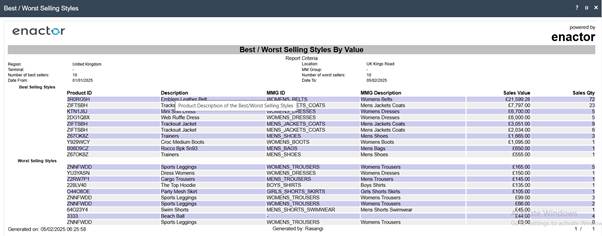
This completes the Best / Worst Selling Styles by Value Report.
MMG Summary Pie Chart
The MMG Summary Pie Chart report enables the user to view MMG Summary information in pie chart form. The chart provides a visual breakdown of sales by merchandise group.
Navigate to the MMG Summary Pie Chart using the Search or the path: Reports > Product Reports > MMG Summary Pie Chart

Filter Criteria
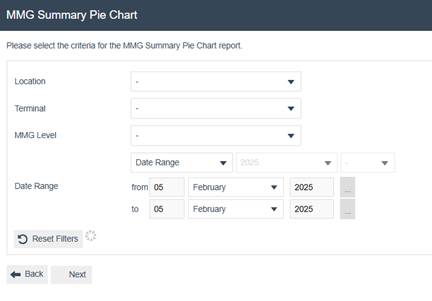
| Filter Criteria | Description |
|---|---|
| Location | Dropdown list selection of configured Locations. If no Region is specified, all Locations configured are shown. |
| Terminal | Dropdown selection from a list of all Terminals configured at the selected Location. If no Location is specified, all Terminals configured are shown. |
| MMG Level | Dropdown list selection of fixed options: levels 1 to 10. |
| Date Range | The date range required to generate the report. |
Press Back to return to the previous screen. Press Next to create a scheduled job to run the report. Press Reset Filters to clear all selections.
Wait For Report
When a report is submitted, the system displays a progress screen indicating the report is in a queue. Several self-explanatory messages can appear at this point with options to Cancel, Don't Wait, or Refresh.
| Button | Description |
|---|---|
| Cancel | Cancels the report job. |
| Don't Wait | Allows the user to continue working. The report will be available from saved reports when complete. |
| Refresh | Refreshes the report status if it seems to be taking a long time to display. |
Report Summary
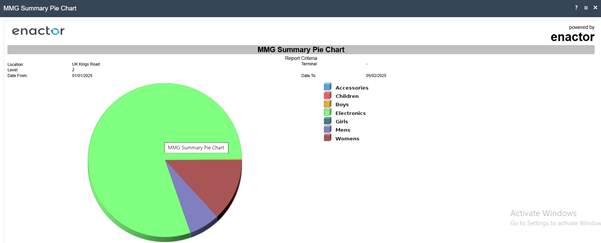
The data is also represented in a table format below the chart:

This completes the MMG Summary Pie Chart.
MMG Summary
The MMG Summary report tabulates the sales details based on the MMG Level defined at report criteria. This report provides a text-based summary as an alternative to the pie chart view.
Navigate to the MMG Summary using the Search or the path: Reports > Product Reports > MMG Summary

Filter Criteria
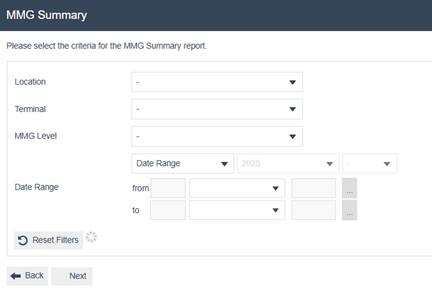
| Filter Criteria | Description |
|---|---|
| Region | Dropdown list selection of configured Regions. |
| Location | Dropdown list selection of configured Locations in the selected Region. If no Region is specified, all Locations configured are shown. |
| Terminal | Dropdown selection from a list of all Terminals configured at the selected Location. If no Location is specified, all Terminals configured are shown. |
| MMG Level | Dropdown list selection of fixed options: levels 1 to 10. |
| Date Range | The date range required to generate the report. |
Press Back to return to the previous screen. Press Next to create a scheduled job to run the report. Press Reset Filters to clear all selections.
Wait For Report
When a report is submitted, the system displays a progress screen indicating the report is in a queue. Several self-explanatory messages can appear at this point with options to Cancel, Don't Wait, or Refresh.
| Button | Description |
|---|---|
| Cancel | Cancels the report job. |
| Don't Wait | Allows the user to continue working. The report will be available from saved reports when complete. |
| Refresh | Refreshes the report status if it seems to be taking a long time to display. |
Report Summary

This completes the MMG Summary.
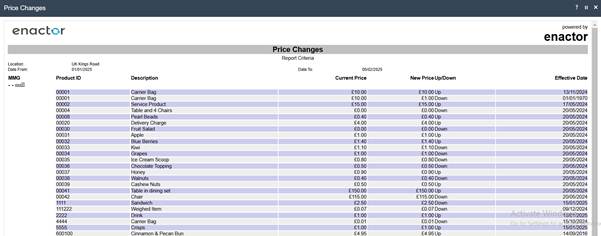
Price Changes
The Price Changes report tabulates the details of price changes done during a specified period of time.
Navigate to the Price Changes report using the Search or the path: Reports > Product Reports > Price Changes

Filter Criteria
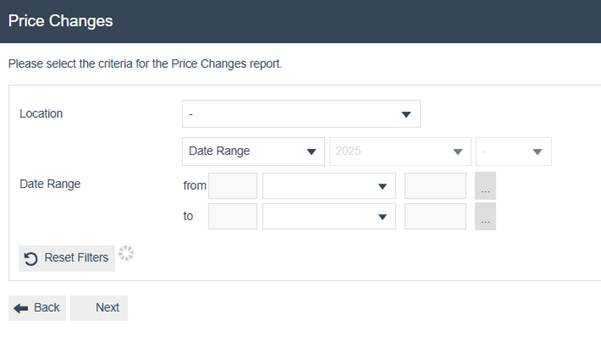
| Filter Criteria | Description |
|---|---|
| Location | Dropdown list selection of configured Locations. If no Region is specified, all Locations configured are shown. |
| Date Range | The date range required to generate the report. |
Press Back to return to the previous screen. Press Next to create a scheduled job to run the report. Press Reset Filters to clear all selections.
Wait For Report
When a report is submitted, the system displays a progress screen indicating the report is in a queue. Several self-explanatory messages can appear at this point with options to Cancel, Don't Wait, or Refresh.
| Button | Description |
|---|---|
| Cancel | Cancels the report job. |
| Don't Wait | Allows the user to continue working. The report will be available from saved reports when complete. |
| Refresh | Refreshes the report status if it seems to be taking a long time to display. |
Report Summary
This completes the Price Changes Report.
Product Sales
The Product Sales report tabulates product sales data including units sold and sales values.
Navigate to the Product Sales report using the Search or the path: Reports > Product Reports > Product Sales

Filter Criteria

| Filter Criteria | Description |
|---|---|
| Location | Dropdown list selection of configured Locations. If no Region is specified, all Locations configured are shown. |
| Terminal | Dropdown selection from a list of all Terminals configured at the selected Location. If no Location is specified, all Terminals configured are shown. |
| MM Group | Dropdown list selection of defined MM Groups. |
| Date Range | The date range required to generate the report. |
Press Back to return to the previous screen. Press Next to create a scheduled job to run the report. Press Reset Filters to clear all selections.
Wait For Report
When a report is submitted, the system displays a progress screen indicating the report is in a queue. Several self-explanatory messages can appear at this point with options to Cancel, Don't Wait, or Refresh.
| Button | Description |
|---|---|
| Cancel | Cancels the report job. |
| Don't Wait | Allows the user to continue working. The report will be available from saved reports when complete. |
| Refresh | Refreshes the report status if it seems to be taking a long time to display. |
Report Summary
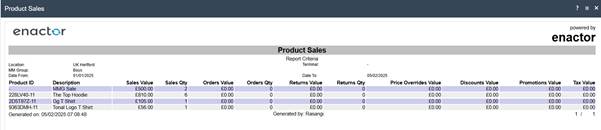
This completes the Product Sales Report.
Replenishments
The Replenishments report enables the user to view replenishment information according to specified criteria.
Navigate to the Replenishments report using the Search or the path: Reports > Product Reports > Replenishments

Filter Criteria

| Filter Criteria | Description |
|---|---|
| Location | Dropdown list selection of configured Locations. If no Region is specified, all Locations configured are shown. |
| MM Group | Dropdown list selection of defined MM Groups. |
| Top | Numeric value indicating the number of best sellers to display. The default value is 10. |
| Date Range | The date range required to generate the report. |
Press Back to return to the previous screen. Press Next to create a scheduled job to run the report. Press Reset Filters to clear all selections.
Wait For Report
When a report is submitted, the system displays a progress screen indicating the report is in a queue. Several self-explanatory messages can appear at this point with options to Cancel, Don't Wait, or Refresh.
| Button | Description |
|---|---|
| Cancel | Cancels the report job. |
| Don't Wait | Allows the user to continue working. The report will be available from saved reports when complete. |
| Refresh | Refreshes the report status if it seems to be taking a long time to display. |
Report Summary

This completes the Replenishments Report.
Returns
The Returns report enables the user to view return information according to set criteria.
Navigate to the Returns report using the Search or the path: Reports > Product Reports > Returns

Filter Criteria

| Filter Criteria | Description |
|---|---|
| Location | Dropdown list selection of configured Locations. If no Region is specified, all Locations configured are shown. |
| Terminal | Dropdown selection from a list of all Terminals configured at the selected Location. If no Location is specified, all Terminals configured are shown. |
| MM Group | Dropdown list selection of defined MM Groups. |
| Date Range | The date range required to generate the report. |
Press Back to return to the previous screen. Press Next to create a scheduled job to run the report. Press Reset Filters to clear all selections.
Wait For Report
When a report is submitted, the system displays a progress screen indicating the report is in a queue. Several self-explanatory messages can appear at this point with options to Cancel, Don't Wait, or Refresh.
| Button | Description |
|---|---|
| Cancel | Cancels the report job. |
| Don't Wait | Allows the user to continue working. The report will be available from saved reports when complete. |
| Refresh | Refreshes the report status if it seems to be taking a long time to display. |
Report Summary
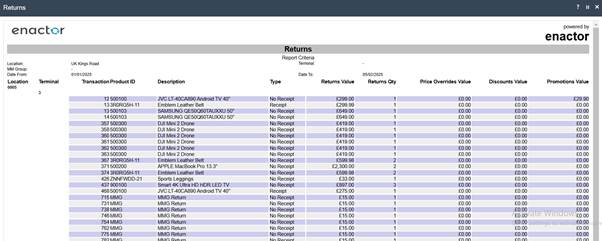
This completes the Returns Report.
Rolling Replenishment Stock Ledger Transactions
The Rolling Replenishment Stock Ledger Transactions report tabulates stock ledger transaction details for products in rolling replenishment.
Navigate to the Rolling Replenishment Stock Ledger Transactions report using the Search or the path: Reports > Product Reports > Rolling Replenishment Stock Ledger Transactions

Filter Criteria
| Filter Criteria | Description |
|---|---|
| Region | Dropdown list selection of configured Regions. |
| Location | Dropdown list selection of configured Locations in the selected Region. If no Region is specified, all Locations configured are shown. |
| Terminal | Dropdown selection from a list of all Terminals configured at the selected Location. If no Location is specified, all Terminals configured are shown. |
| MM Group | Dropdown list selection of defined MM Groups. |
| Top | Numeric value indicating the number of best sellers to display. The default value is 10. |
| Bottom | Numeric value indicating the number of worst sellers to display. The default value is 10. |
| Date Range | The date range required to generate the report. |
Press Back to return to the previous screen. Press Next to create a scheduled job to run the report. Press Reset Filters to clear all selections.
Wait For Report
When a report is submitted, the system displays a progress screen indicating the report is in a queue. Several self-explanatory messages can appear at this point with options to Cancel, Don't Wait, or Refresh.
| Button | Description |
|---|---|
| Cancel | Cancels the report job. |
| Don't Wait | Allows the user to continue working. The report will be available from saved reports when complete. |
| Refresh | Refreshes the report status if it seems to be taking a long time to display. |
Report Summary

This completes the Rolling Replenishment Stock Ledger Transactions Report.