How To Configure Enactor Logs
This guide describes the logs created by the Enactor suite of applications and provides guidance for configuring logging for specific cases.
Introduction
Enactor generates logs across all device types in the estate. Understanding where logs are located and how to configure them is essential for troubleshooting issues at the POS, on mobile devices, at the Store Server, and within the Estate Manager.
Overview
This guide covers the following:
- Description of the different types of logging in Enactor
- Locations of logs across different devices
- Configuration of log property files to increase or decrease the level of detail included in each log and to switch on logging for specific scenarios
You should be familiar with editing configuration files before following this guide.
Enactor Logging
This section is divided by device type and covers the POS, the PDP Server, the Store Server, and the Estate Manager.
POS Logging
POS logs are generated in the <Enactor home>/logs directory.
The two most important logs are pos.log and common.log.
pos.log
pos.log is generated by the POS application and can be used for troubleshooting any issues seen on the POS UI. For example, if a system error message is displayed on the POS, a corresponding log entry will be written to pos.log.
Configuration settings for pos.log can be found in:
<Enactor home>/pos/config/enactor-pos.log.properties
common.log
common.log is generated by the Enactor POS Services, which run as a Windows service. This log can be used for diagnosing issues with any background processing such as receiving broadcasts or document processing.
Configuration settings for common.log can be found in:
<Enactor home>/pos/config/enactor.log.properties
PDP Server Logging
PDP logs are generated in the <Enactor home>/logs directory.
The two most important logs are listener.log and common.log.
listener.log
listener.log is generated by the Enactor PDP Listener Windows service and can be used for troubleshooting any issues seen on mobile client devices. For example, if a system error message is displayed on a mobile client device, a corresponding log entry will be written to listener.log.
Configuration settings for listener.log can be found in:
<Enactor home>/pdpServer/config/enactor-pdp-server.log.properties
common.log
common.log is generated by the Enactor PDP Services, which run as a Windows service. This log can be used for diagnosing issues with any background processing such as receiving broadcasts or document processing.
Configuration settings for common.log can be found in:
<Enactor home>/pdpServer/config/enactor.log.properties
Store Server Logging
Enactor Logs
Numerous Enactor logs are generated on the Store Server.
Before looking at the logs, it is useful to have a basic understanding of how the Store Server application is structured.
When a Store Server is built, an instance of Apache Tomcat is installed and numerous web applications are deployed in four separate WAR files, as described below:
| WAR File | Description |
|---|---|
| Web Core | Contains the services that should be deployed on every tier of the Enactor Estate |
| Web Reports | Responsible for generating reports on the Store Server |
| Web Store Management | Provides the Store Server UI |
| Web Store Processing | Provides processing services for the Store Server |
Each of these web applications generates its own log. All logs are written to <Enactor home>/storeServer/logs.
web-core.log
web-core.log is generated by the Enactor Web Core application and can be used for troubleshooting any issues with the Enactor core services.
Configuration settings for web-core.log can be found in:
<Enactor home>/storeServer/config/enactor-web-core.log.properties
web-reports.log
web-reports.log is generated by the Enactor Web Reports application and can be used for troubleshooting report issues.
Configuration settings for web-reports.log can be found in:
<Enactor home>/storeServer/config/enactor-web-reports.log.properties
web-store-management.log
web-store-management.log is generated by the Enactor Web Store Management application. This log can be used for diagnosing issues with the numerous applications contained within the Store Server web UI.
Configuration settings for web-store-management.log can be found in:
<Enactor home>/storeServer/config/enactor-web-store-management.log.properties
web-store-processing.log
web-store-processing.log is generated by the Enactor Web Store Processing application. This log can be used for diagnosing issues with background processing such as receiving broadcasts or document processing.
Configuration settings for web-store-processing.log can be found in:
<Enactor home>/storeServer/config/enactor-web-store-processing.log.properties
Apache Tomcat Logs
In addition to the logs written by the Enactor application, numerous logs are written by the Apache Tomcat web server. Enactor configures Apache Tomcat so these logs are also written to <Enactor home>/storeServer/logs.
Further information about Tomcat logging can be found in the Apache Tomcat 9.0 Logging documentation.
Estate Manager Logging
The Enactor Estate Manager provides several logging applications within the UI. These can be found at the following path:
Administration > Logs
Activity Log
The Activity Log provides a full audit trail of any changes made in the Enactor Estate Manager.

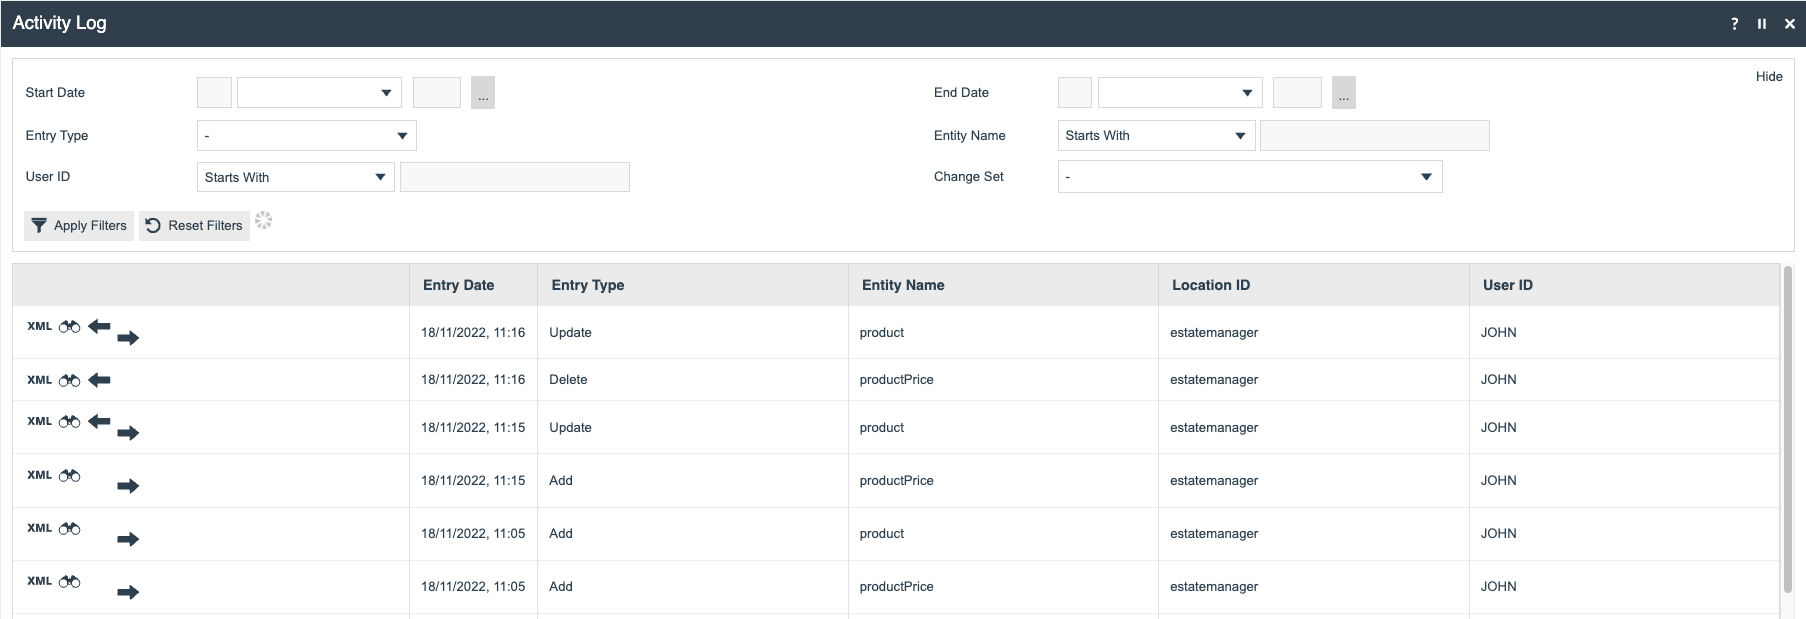
To filter the entries listed, enter values for the following fields and select Apply Filters:
| Property | Description |
|---|---|
| Start Date | Beginning of a date range selection |
| End Date | End of a date range selection |
| Entry Type | Dropdown selection from a fixed list: data operations Add, Update, or Delete, or logged activities of Other types |
| Entity Name | Selects for activity pertaining to a specific entity |
| User ID | Selects for activity conducted by a specific user |
| Change Set | Dropdown list selection of defined change sets. Selects for activity conducted in the specific change set |
Activity Log Entry - General Tab View
Using the icons in the left column of the select page, which are available as appropriate for each entry, the user can examine the individual entries. For all entries the View option (![]() ) provides access to an Activity Log entry viewing page.
) provides access to an Activity Log entry viewing page.
For entries that record data operations, the View page provides access to before and after images of the entity as described below. The Activity Log entry also provides access to the Web Maintenance page for the relevant entity to view either the pre-update or post-update state of the instance using the respective (![]() ) or (
) or (![]() ) icons.
) icons.
For Other operations, the Details Tab for the entry provides details of the operation performed. In these cases, the View option (![]() ) also provides a Raw XML Function viewing tab as described below.
) also provides a Raw XML Function viewing tab as described below.
Activity Log Entry - XML Before and After Action Tab View
For entries that record data operations (Add, Update, or Delete), the View page contains XML format before and after versions of the entity instance in separate tabs of the page. These XML representations of the instance may be extracted (by copy and paste) into text files for precise comparison, or the pre-update image of an update or deletion may be applied in the File Import facility of Web Maintenance to restore the instance (available at Administration > Data Management).
For Other operations, the Function XML tab of the Activity Log View page provides access to an XML representation of the log entry created by the activity function, which may be a transaction, message queue entry, or XML formatted logging details created by the activity function.
Application Log
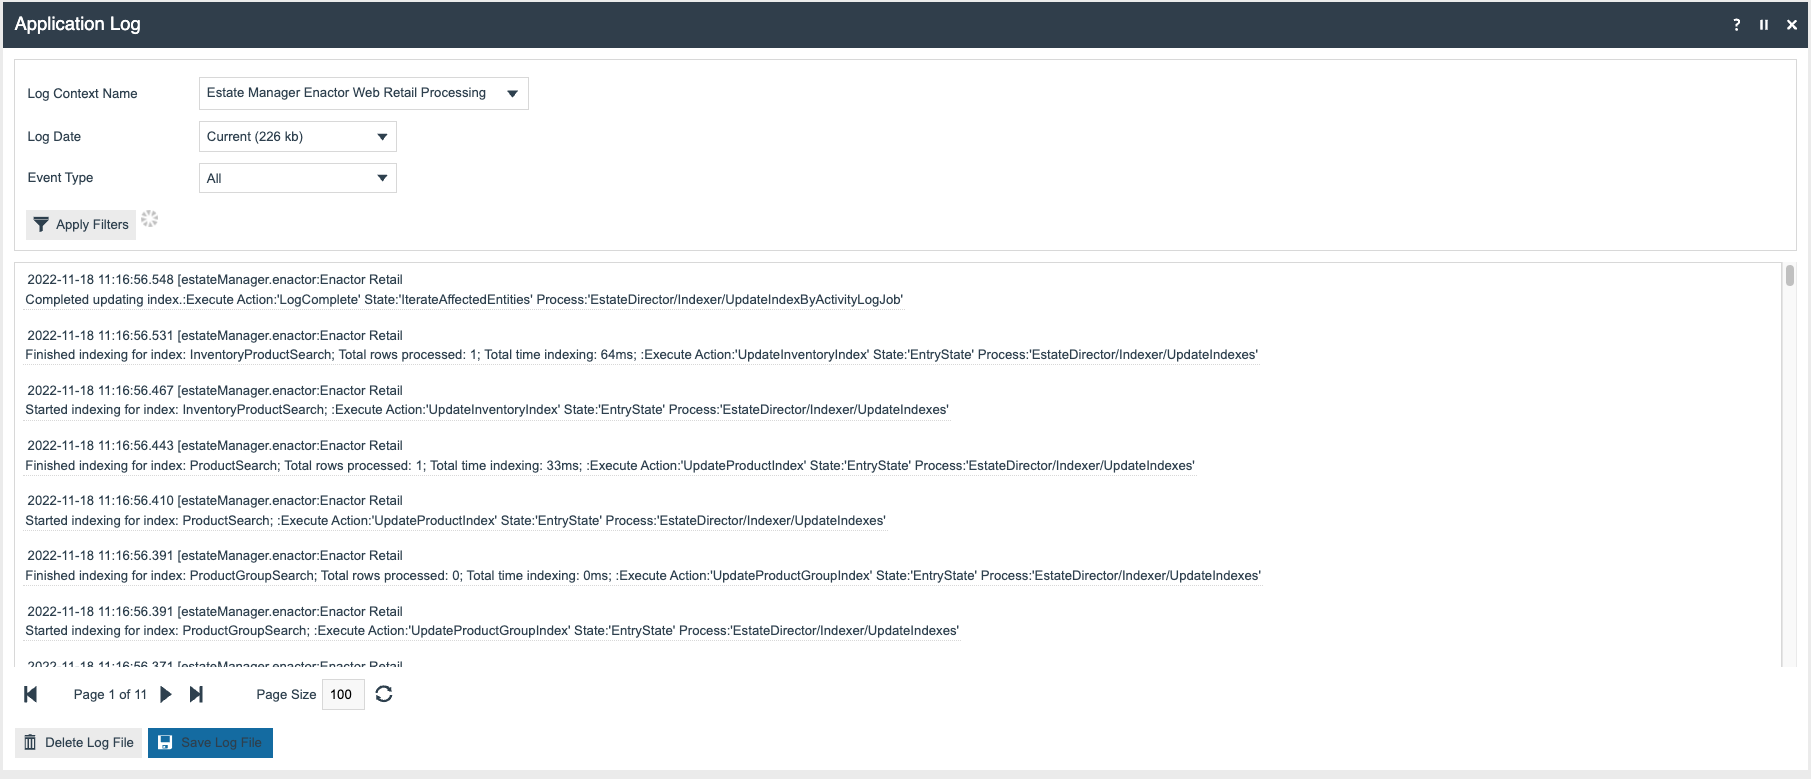
The Application Log provides a UI for all the logs generated by the various web applications that make up the Estate Manager.
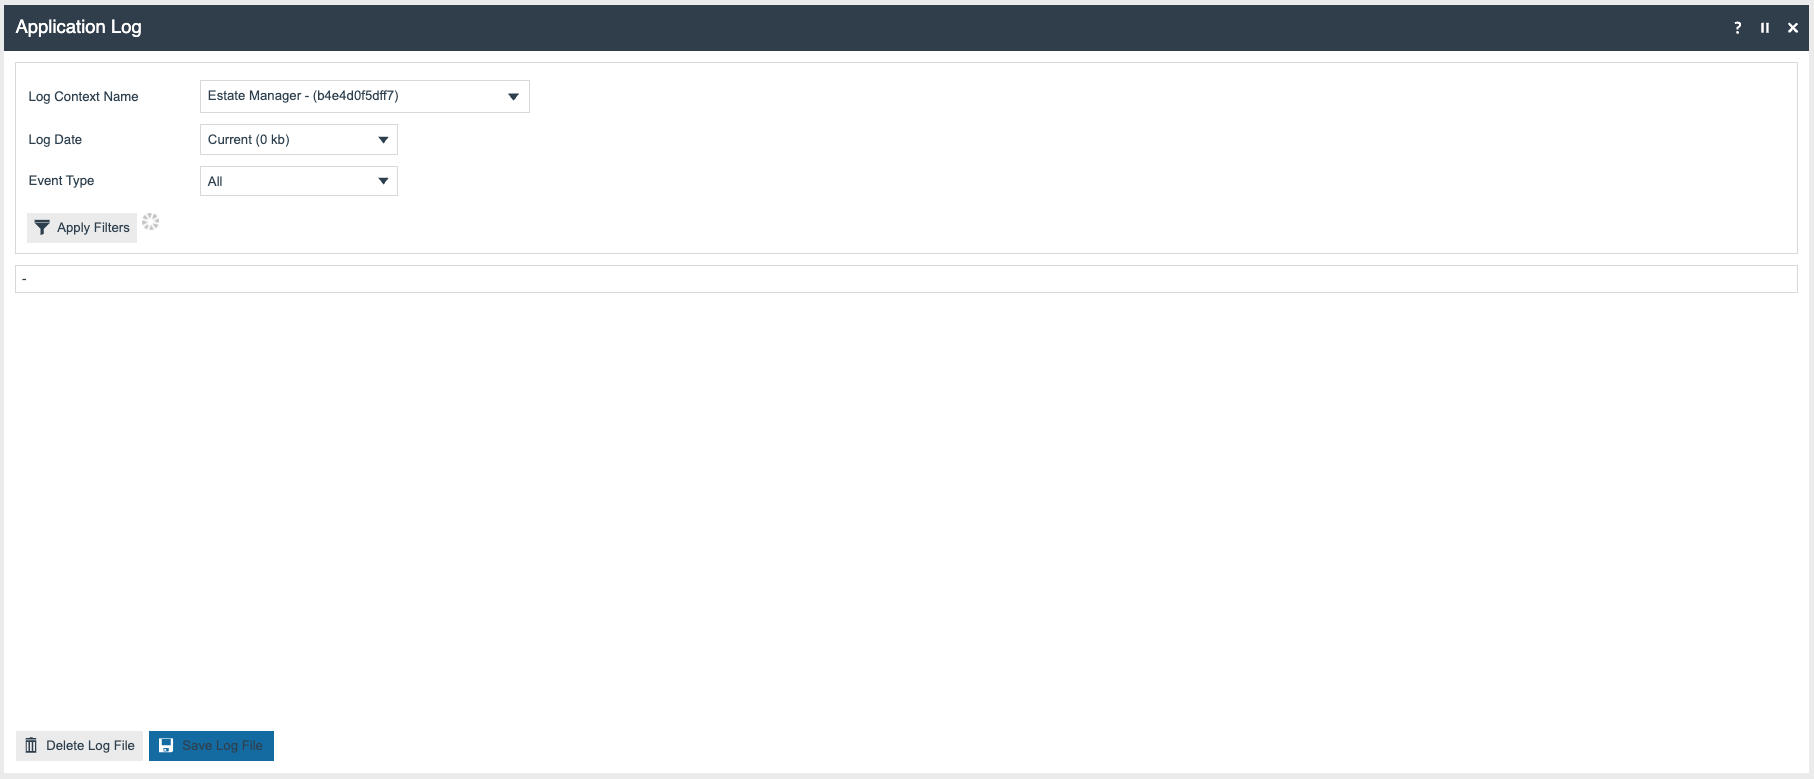
Selecting the Log Context Name drop-down gives a list of the available logs:
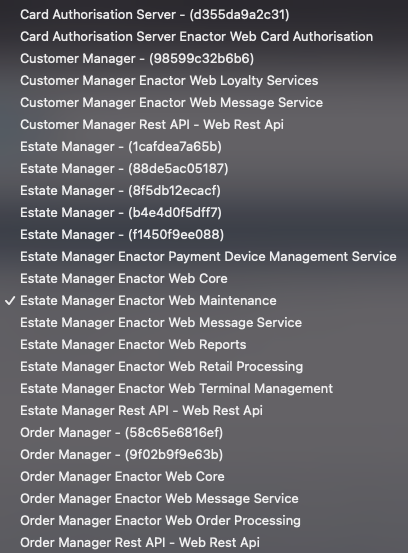
After a log is selected, it can be viewed in the Application Log UI:
In cases where an error and stack trace has been generated, a binocular icon is displayed next to the error. Selecting this allows the user to view the stack trace in full:
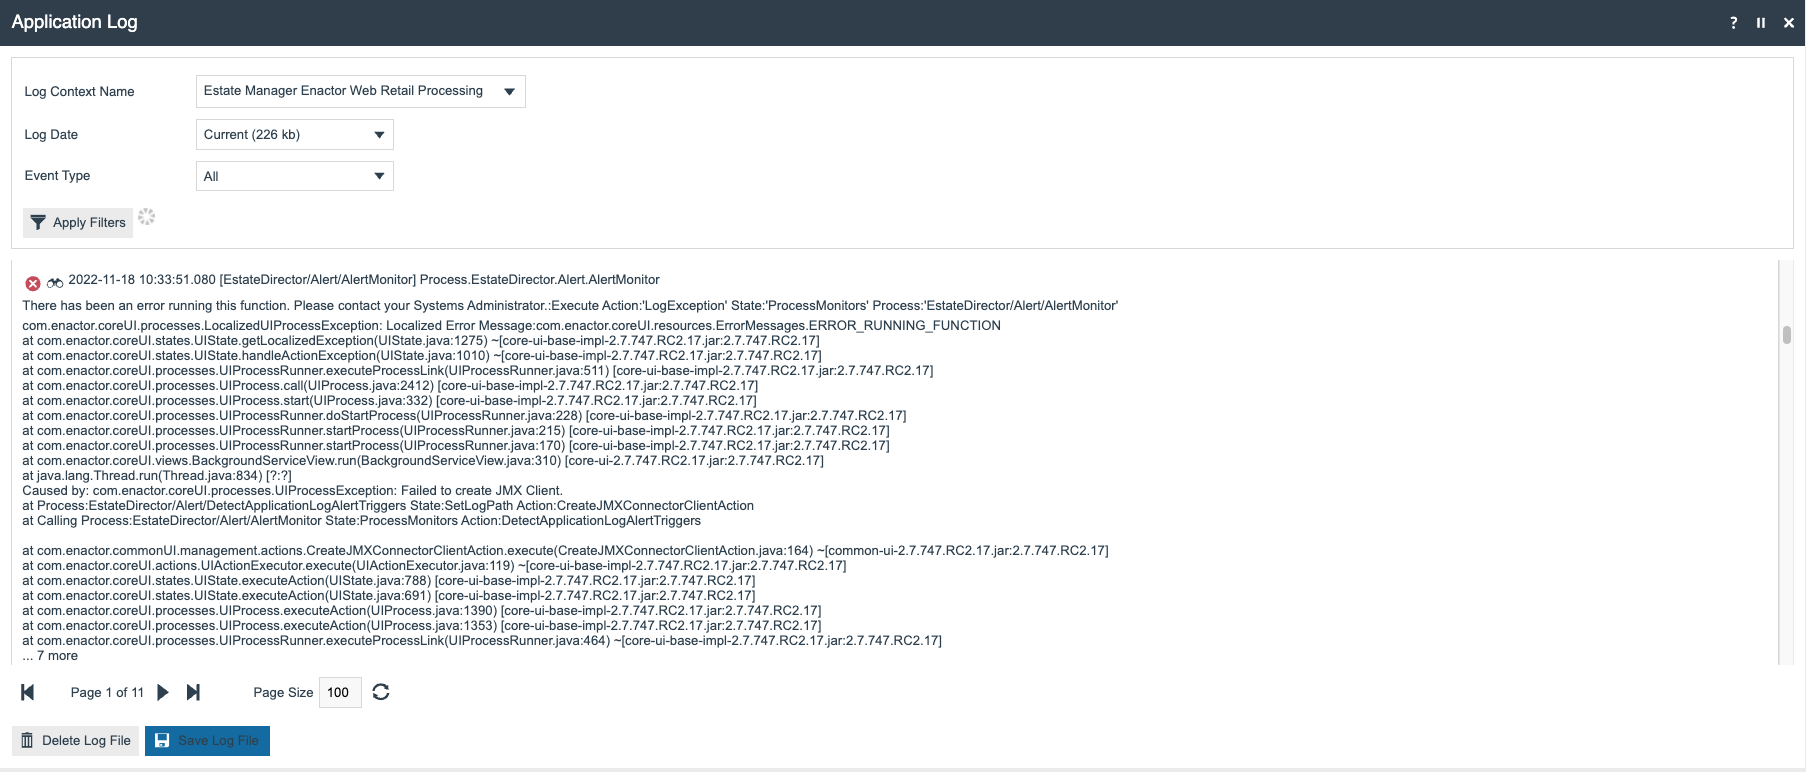
It is possible to download and view the raw log by selecting the Save Log File button, then opening the file in a log viewer or text editor.
The Estate Manager is structured in a very similar way to the Store Server as described earlier. The logs described below are most likely to be of interest in diagnosing issues.
Estate Manager Enactor Web Core
The Estate Manager Enactor Web Core log is generated by the Enactor Web Core application and can be used for troubleshooting any issues with the Enactor core services.
Estate Manager Enactor Web Reports
The Estate Manager Enactor Web Reports log is generated by the Enactor Web Reports application and can be used for troubleshooting report issues.
Estate Manager Enactor Web Maintenance
The Estate Manager Enactor Web Maintenance log is generated by the Enactor Web Maintenance application. This log can be used for diagnosing issues with the numerous applications contained within the Estate Manager web UI.
Estate Manager Enactor Web Retail Processing
The Estate Manager Enactor Web Retail Processing log is generated by the Enactor Web Retail Processing application. This log can be used for diagnosing issues with background processing such as sending broadcasts or document processing.
Card Authorisation Server Enactor Web Card Authorisation
The Card Authorisation Server Enactor Web Card Authorisation log is generated by the Enactor Web Card Authorisation application. This log can primarily be used for diagnosing issues with the Enactor gift card service.
Application Process Log
The Application Process Log records events deemed significant at the level of process design. Application processes are often executed as scheduled jobs. However, application processes running as background services often consume message entries from one or more queues, process the objects received, and post outputs to another queue or queues. Although Application Process Log entries are generated sequentially, they are ordered for presentation according to the process execution in which they occur.
The Application Process Log is available on the Estate Manager and on each Store Server device.
The Application Process Log page shows details of application process activity. As illustrated in the example below, each entry is listed in the log, grouped for the process showing type (also using the Error (![]() ), Warning (
), Warning (![]() ), or Informational (
), or Informational (![]() ) icons), date and time of the message, the message, Device ID, Entry Type, Reference ID, Process ID, and User ID.
) icons), date and time of the message, the message, Device ID, Entry Type, Reference ID, Process ID, and User ID.
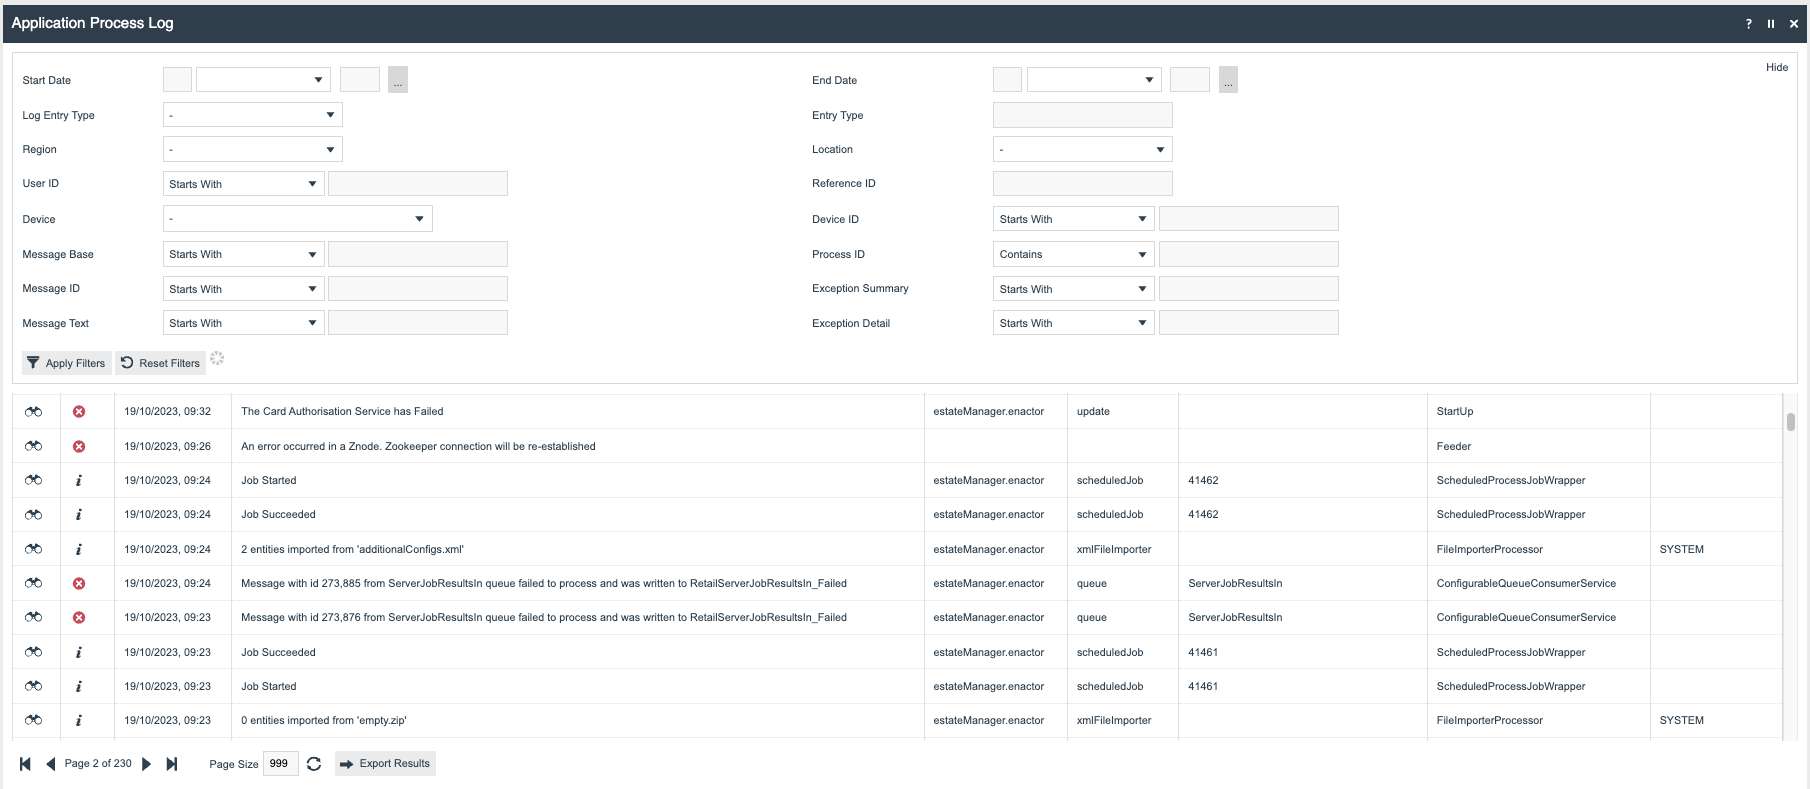
The following filters are available in the Application Process Log:
| Filter | Description |
|---|---|
| Log Entry Type | Dropdown selection from a list - Errors, Warnings, Information, or Debug |
| Start Date | Beginning of a date range selection within which entries occurred |
| End Date | End of a date range selection within which entries occurred |
| Region | Dropdown selection from a list of configured regions |
| Location | Dropdown selection from a list of configured locations |
| User ID | Select entries based on the user account under which the application process was executing |
| Device | Dropdown selection from a list of configured devices. Selects entries for the device on which they occurred |
| Device ID | Allows filtering based on a partial or full device ID |
| Entry Type | The way the application process has been executed (usually scheduledJob) |
| Reference ID | This refers to the ID of the scheduled job that triggered the log entry |
| Process ID | The ID of the application process executing (e.g. DayStartJob) |
Application Process Log - View
Individual entries can be viewed using the View icon (![]() ) in the left column of the list.
) in the left column of the list.
The log information is presented in tabs available in the View page depending on the type of log entry. All fields are read-only.
Application Process Log - General Tab View
The General tab shows general details of the selected application process log entry. The fields are:
| Property | Description |
|---|---|
| Type | The type of log entry, e.g. Error |
| Date | Date and time at which the log entry occurred |
| Entry Type | Type of activity which caused the log entry, e.g. businessProcess |
| Reference ID | ID of the reference for the log entry |
| Process ID | ID of the process which caused the log entry, e.g. Task/ServerProcessRunner |
| Device ID | ID of the device where the problem occurred |
| User ID | ID of the user associated with the problem |
| Message ID | ID of the message in the file specified in the following field, e.g. GENERATE_ADJUSTMENT_PDF_ERROR_2 |
| Message Base | The file which contains the message detailed in the previous field, e.g. InventoryManagement/Adjustments/AdjustStockAtLocationMessages |
| Message | The message generated using the message ID and message base defined in the previous fields |
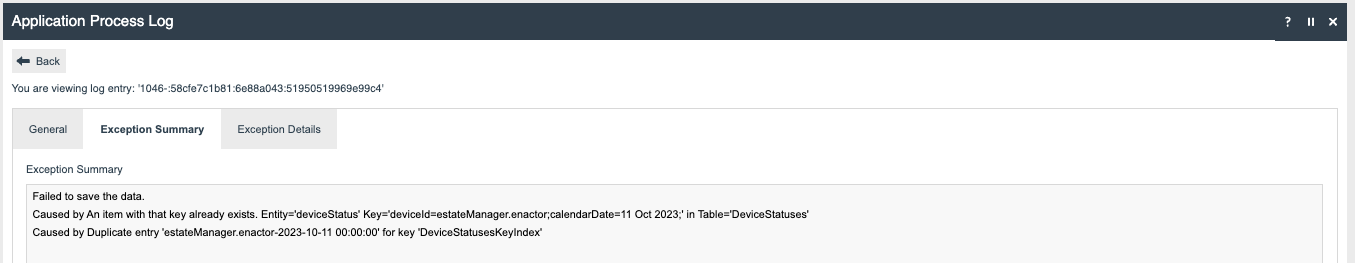
Application Process Log - Exception Summary Tab View
The Exception Summary tab shows summary details of the exception that occurred corresponding to the selected log entry.
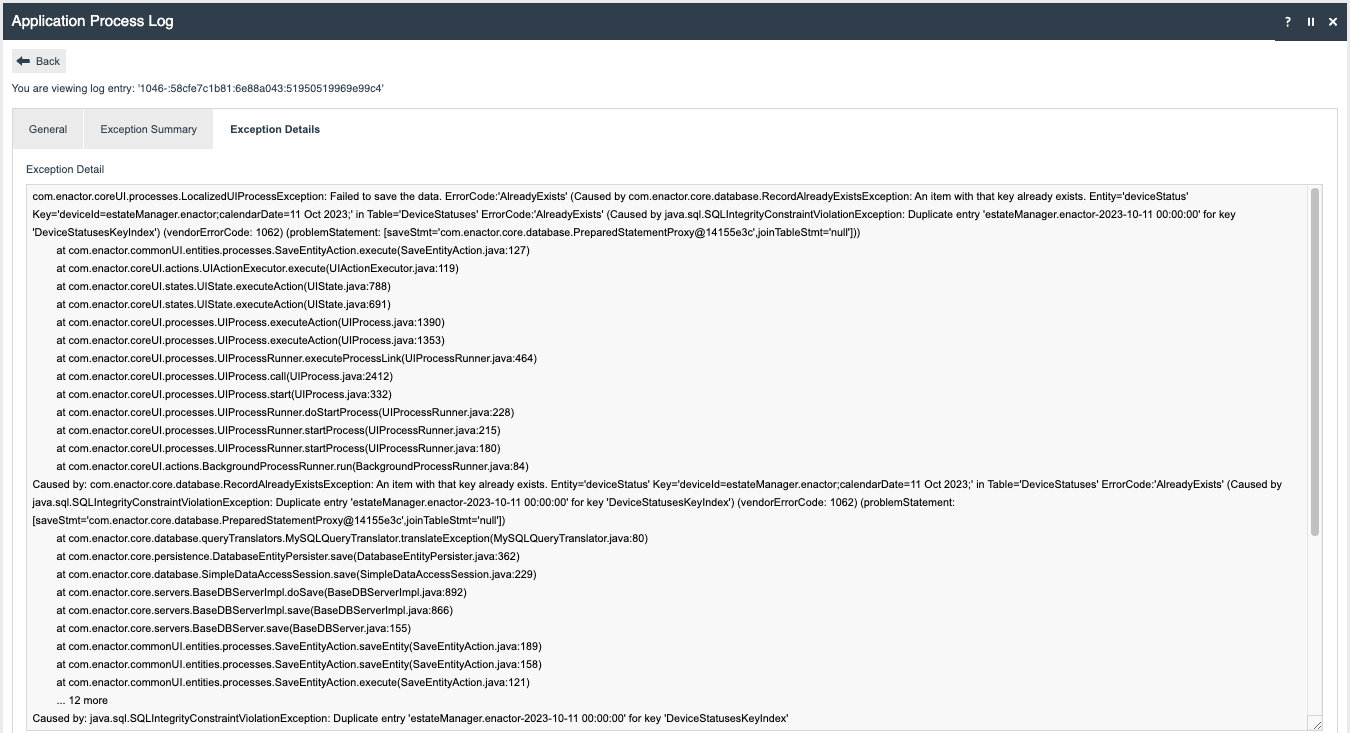
Application Process Log - Exception Details Tab View
The Exception Details tab shows exception details of the selected application process log entry.
Changing Logging Configuration
It is possible to change logging levels and define specific logging on all devices except the Estate Manager.
If an issue is detected, Enactor may ask for some specific class or process logging to be switched on. If this is the case, Enactor will specify which log properties file this should be added to.
Once the changes to the log properties file have been made, the relevant application must be restarted to pick up the change.
Class Logging
Add an entry for the class in the form {class}.level=LOG_{level} where {class} is the class name and {level} is the log level. The example below logs debug for all com.enactor classes.
Amend com.enactor.level to the specific class to be debugged.
com.enactor.level=LOG_DEBUG
Useful Class Logging Examples
Promotion Engine Code Debug Logging
The following turns on debug logging of the Promotion Engine at code level:
com.enactor.mfc.promotion.engine.PromotionEngine.level=LOG_DEBUG
com.enactor.mfc.promotion.engine.PromotionResponseTree.level=LOG_DEBUG
com.enactor.mfc.promotion.engine.PromotionCombinations.level=LOG_DEBUG
Database Performance Logging
Writes out performance logging for the database in the Performance/SQL directory:
com.enactor.core.management.PerformanceLogger.level=LOG_DEBUG
com.enactor.core.database.PerformanceLogger.level=LOG_DEBUG
Privilege Logging
Enables writing out to the log the missing privilege when an operator does not have permission to perform a function:
com.enactor.coreUI.actions.CheckPrivilegesAction.level=LOG_DEBUG
com.enactor.coreUI.actions.CheckPrivilegesForUserAction.level=LOG_DEBUG
Peripheral Logging
Enables debug logging for any peripherals attached to the POS:
com.enactor.peripherals.level=LOG_DEBUG
Process Logging
The following entries need to be added to the log properties file to enable process logging, where Process.level can be changed to Process.<parent process to log>.level to monitor a specific process, e.g. Process.Pos.SignOn.SignOn.level=LOG_DEBUG. Note that the process ID uses dots instead of slashes.
Turn on process debugging (the following three coreUI classes must be set to LOG_DEBUG for it to be activated):
com.enactor.coreUI.processes.UIProcess.level=LOG_DEBUG
com.enactor.coreUI.states.UIState.level=LOG_DEBUG
com.enactor.coreUI.actions.UIActionExecutor.level=LOG_DEBUG
Process.<parent process to log>.level=LOG_DEBUG
If this is required, Enactor will provide the name of the process(es) to be added to the relevant log configuration file.
Once the changes to the log properties file have been made, the relevant application must be restarted to pick up the change.