How-to Guide - Operation Reports - EM - Cash Management
Introduction
The Enactor application generates numerous types of reports to support different business purposes. This guide covers the Cash Management reports that are accessed through the Estate Manager or the Store Server.
The purpose of this guide is to describe each of the Cash Management reports, including how to navigate to them, the available filter criteria, and the report output columns.
Overview
The following Cash Management reports are covered by this guide:
- Banking Transactions - Safe banking and currency purchase transactions
- Cash On Hand - Cash declared by each terminal, broken down by tender type
- Cash Up Summary - Summary of cash-up session values per terminal or safe
- Income Expense Transactions - Income and expenses recorded in cash management sessions
- Outlay Transactions - Outlay transactions including balanced, unbalanced, and expenses without outlay
- Overview Report - Terminal and safe status summary with cash drawer and cashup data
- Tender Bag Collection - Bags selected and sent to bank
- Terminal Discrepancies - Discrepancy values recorded during terminal cashup or finalise
- Safe Discrepancies - Discrepancy values recorded during safe cashup or finalise
Navigate to the Cash Management reports using the Search or the path: Reports > Cash Management Reports

Prerequisite
To generate Cash Management reports, the basic cash management configurations must be in place. For guidance on these configurations, refer to the How-to Guide on the Day in the Life of Cash Management. These configurations must be active to start the cash management functions that generate data for the reports.
Cash Management Reports
Banking Transactions Report
The Banking Transactions Report is a report related to safe operations that provides an overall summary of banking transactions conducted from a safe within a selected date period. This report focuses on Cash Management function data such as Banking and Currency Purchase.
Navigation
Navigate to the Banking Transaction Report using the Search or the path: Reports > Cash Management Reports > Banking Transaction Report
Prerequisite: To populate the data in the Banking Transaction report, the first step is to create a cash management session in the Safe where Banking and Currency Purchase transactions have been performed.
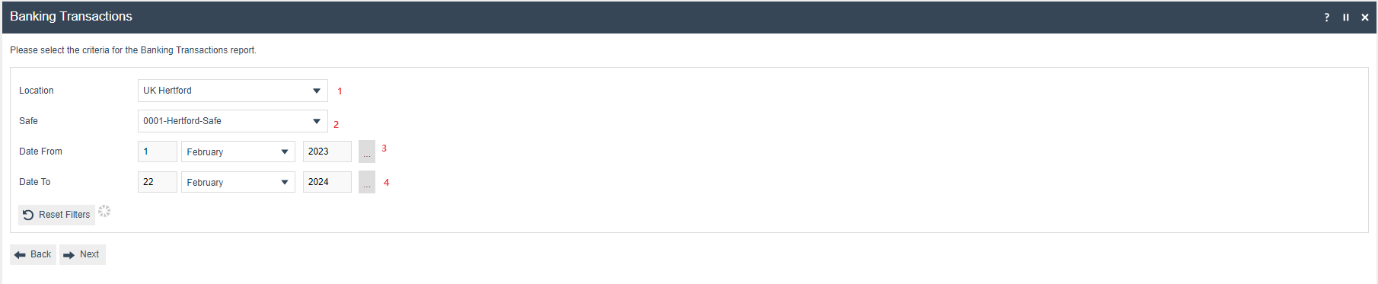
Filter
There are the following filters that help to filter the reporting data.
| Filter Criteria | Description |
|---|---|
| Location | Dropdown list selection of defined Locations. |
| Safe | Dropdown list selection of defined Safes at the Location specified in the previous field. If no Location is specified all Safes are shown. |
| Date From | The From Date which the report needs to be Generated From. |
| Date To | The To Date which the report needs to be Generated To. |
The Back button returns the user to the previous screen. The Next button creates a Scheduled Job to run the report.
Summary
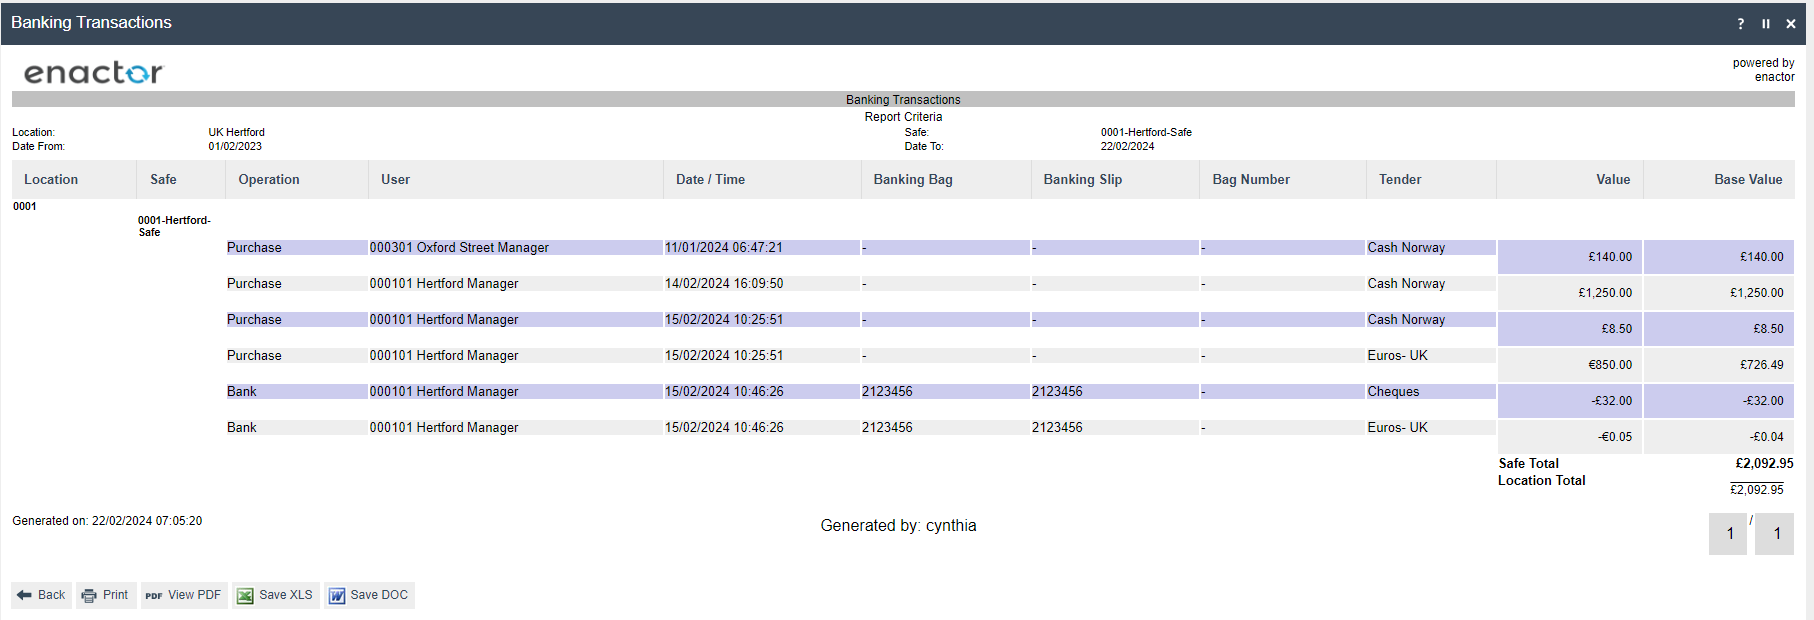
Once the report has been generated the following screen is displayed.
| Report Column Criteria | Description |
|---|---|
| Location | The Defined location on the Filter Criteria. If the location was not selected in the Filter, then all the locations associated with the EM will be displayed. |
| Safe | The selected defined Safes at the Location specified in the Filter Criteria screen will be displayed. If no Safes is specified all Safes associated with the locations are shown. |
| Operation | The Cash Management operation type that was taken place. This would be either a Currency Purchase or Banking. The Currency Purchase is indicated as Purchase, and the Banking action is indicated as Bank in the report summary. |
| User | The User ID who has done the Cash Management transaction. |
| Date/Time | The date and time at which the operation was performed. |
| Banking Bag | When the Banking cash management transaction is associated with a Banking Bag then the Bag id will be displayed. |
| Banking Slip | When a Banking function is done for the reference purpose the user is required to add the Banking slip details. The Slip details will be presented in the report. |
| Bag Number | When the cash management transaction is associated with a Bag then the Bag id will be displayed. |
| Tender | The Type of Tender that was used in the cash management transaction. |
| Value | The value of the Tender. |
| Base Value | The total value of the tender in base currency for the specified criteria. This is mostly used when there are any foreign currencies associated with the Cash Management function. |
| Safe Total | The grand totals for the safe are shown at the bottom of the page. |
| Location Total | The grand totals for the location are shown at the bottom of the page. |
In addition to the report summary, other functions such as view and export are available. The options provide the reports to be Printed or to view the report in PDF and to export the report in XLS or DOC format.
The Back button returns the user to the previous screen.
This completes the Banking Transactions Report.
Cash On Hand Report
The Cash On Hand report provides information on the cash declared by each terminal associated with a specific location. This report offers a detailed breakdown by tender types used, providing a clear picture of the cash holdings for that location.
Navigation
Navigate to the Cash On Hand Report using the Search or the path: Reports > Cash Management Reports > Cash On Hand Report

Prerequisite: To populate the data in the Cash On Hand report there should be a cash management session created in the terminal and once all the transactions are done the terminal user needs to mark the session as Cash Up. To do this the Cashup and Empty, Cash Up and Leave, or Cashup and closing float functions can be used.
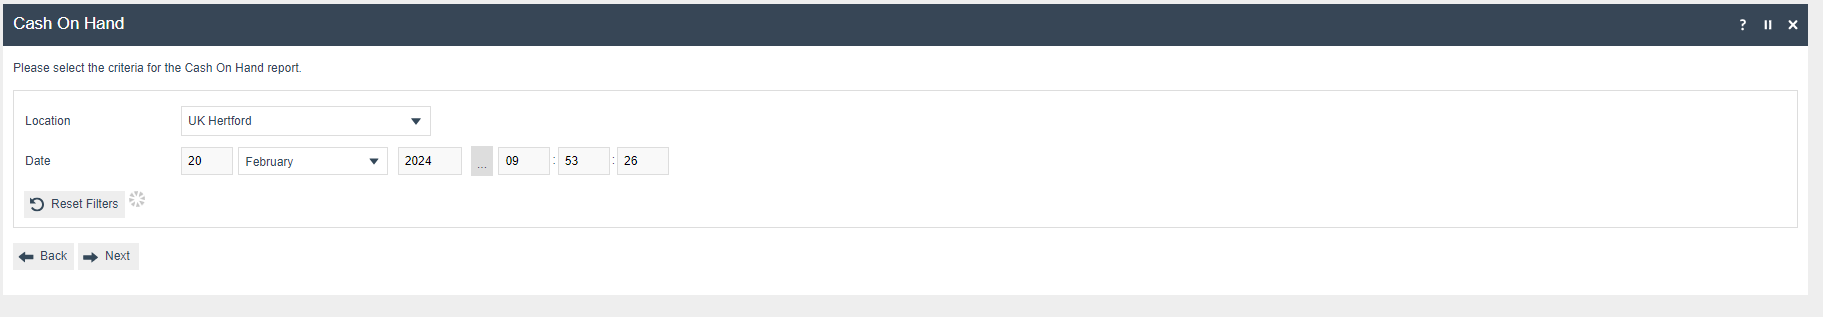
Filter
There are the following filters that help to filter the reporting data.
| Filter Criteria | Description |
|---|---|
| Location | Dropdown list selection of defined Locations. |
| Date | The date and time at which the information is required. It defaults to the current date and time. |
The Reset button resets all the filters to their default value. The Back button returns the user to the previous screen. The Next button creates a Scheduled Job to run the report.
Summary
Once the report has been generated the following screen is displayed.
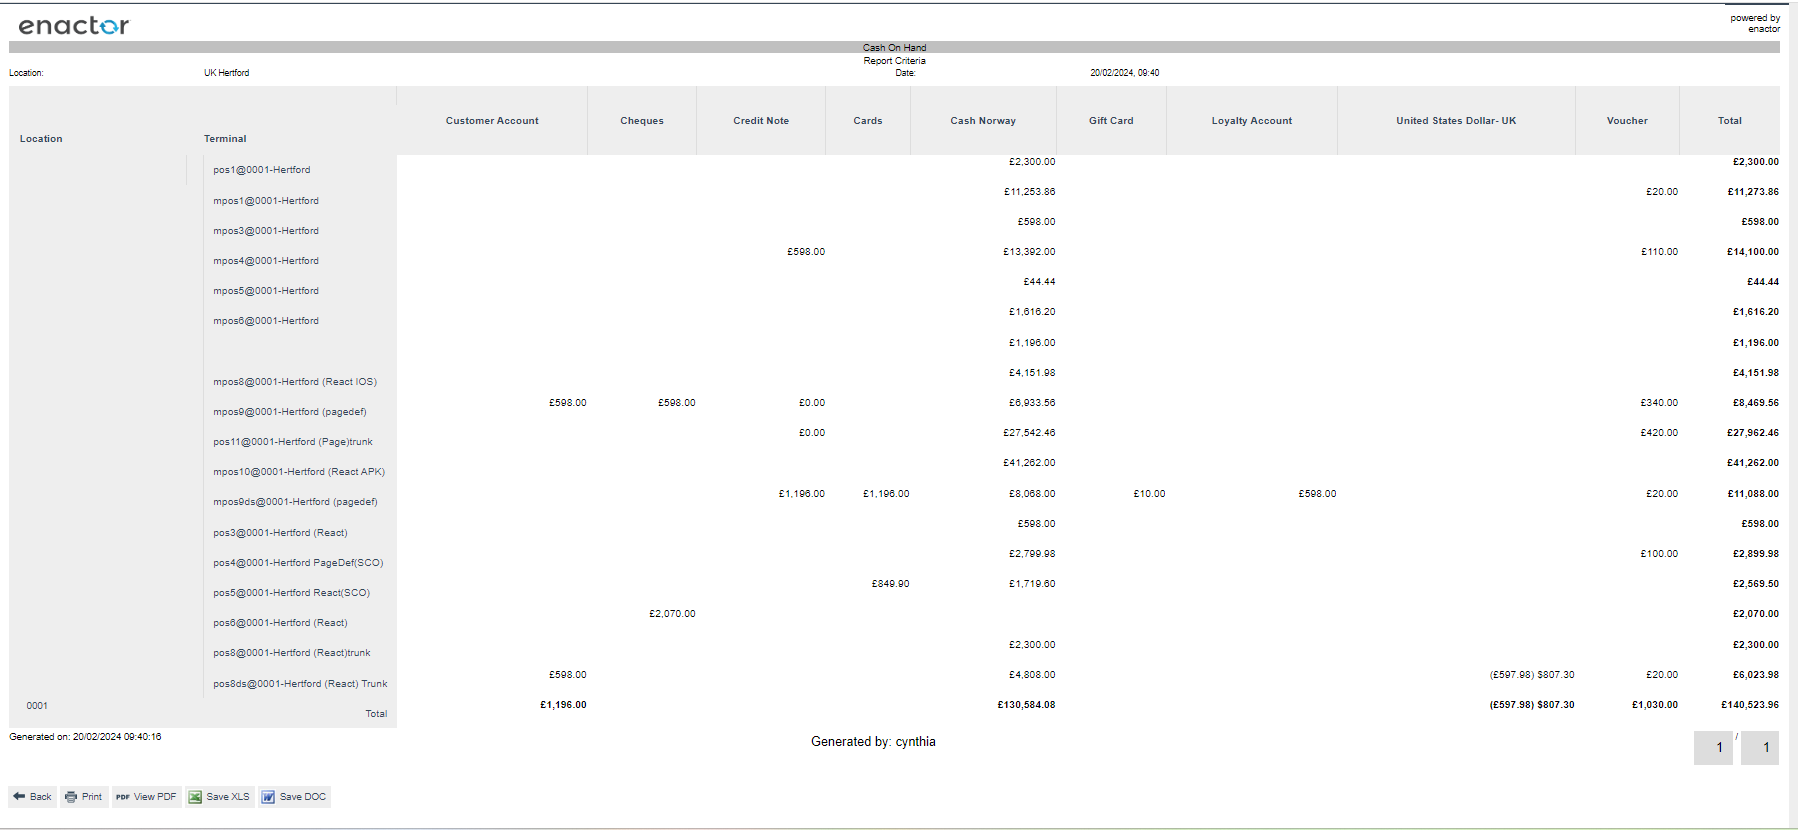
| Report Column Criteria | Description |
|---|---|
| Location | The Defined location on the Filter Criteria. If the location was not selected in the Filter, then all the locations associated with the EM will be displayed. |
| Terminal | The Terminal ID that is associated to the Location. The terminals which have performed Cash Up functions within the date criteria will be displayed. |
| Tender Types | The list of applicable tender types for the selected location will be presented. The tender values will be the values which were declared while doing a Cashup. |
| Total | Total value against each terminal. |
| Grand Total | The Grand Total value against all terminal and tender types. |
In addition to the report summary, other functions such as view and export are available. The options provide the reports to be Printed or to view the report in PDF and to export the report in XLS or DOC format.
The Back button returns the user to the previous screen.
This completes the Cash On Hand Report.
CashUp Summary Report
The CashUp Summary report is a standard report used to obtain a summary of the cashup values in the Terminal or Safe. This report provides details of the cash-up summary, indicating the value of each cash management function that occurred within the cash-up session. The report summarises functions such as Opening Float, Float request, Takings, Float, Pickup, and Closing Float. After the cash-up is completed on the selected Terminal or Safe, any discrepancies will also be displayed in the report.
Navigation
Navigate to the Cashup Summary Report using the Search or the path: Reports > Cash Management Reports > Cashup Summary Report
Prerequisite: To generate the CashUp Summary report, the first step is to perform a cash-up session in a Safe or Terminal. This can be done using functions such as Cashup and Empty, Cash Up and Leave, Cashup and closing float, Cashup, or Cashup and Banking.
Filter
There are the following filters that help to filter the reporting data.

| Filter Criteria | Description |
|---|---|
| Location | Dropdown list selection of defined Locations. |
| Terminal Type | Since this report is common throughout the Safe and Terminal cash management the type must be selected. The terminal type has the value Terminal, Paypoint, Safe and Cashier. This is declared in the Location maintenance for each location to ease the process. |
| Terminal | According to the above fields selection the respective Terminal / Paypoint / Safe / Cashier is displayed which is associated to the selected location. |
| Date | The date and time at which the information is required to. It defaults to the current date and time. |
The Reset button resets all the filters to their default value. The Back button returns the user to the previous screen. The Next button creates a Scheduled Job to run the report.
Summary
Once the report has been generated the following screen is displayed.
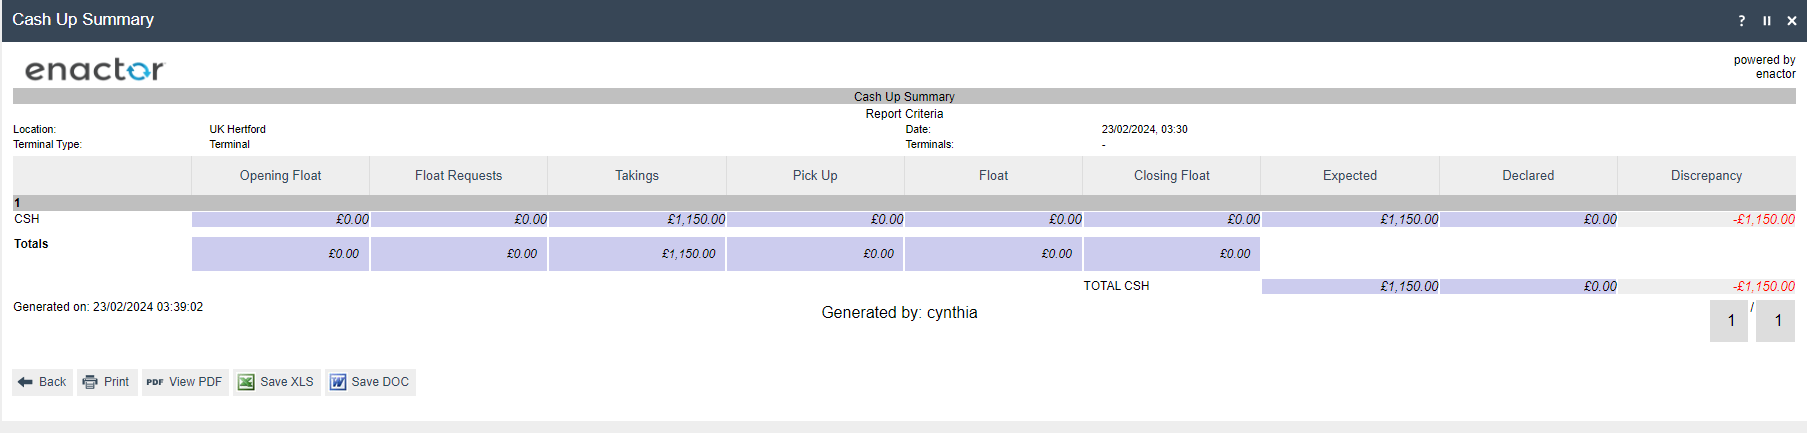
| Report Column Criteria | Description |
|---|---|
| Tender | The Tender type which the Cash Management functions has been done with will be displayed. |
| Opening Float | If there are any Opening float functions that have been done within the session that have been cash up then the Tender in which the Opening Float was done and the value will be displayed. This will be a Positive value since money has been added to the Terminal. |
| Float Request | If there are any Float Request functions that have been done with in the session that has been cash up then the Tender which the Float Request was done and the value will be displayed. |
| Takings | The Sale amount which has been received within the cashup session will be displayed in the column. This will have the accumulative value of the total sales - Return Value. |
| Pickup | If any Pick up functions have been done within the session that have been cash up then the Tender in which the Pickup was done and the value will be displayed. This will be a Negative value since money has been taken from the Terminal and added to the Safe. |
| Float | If any float functions have been done within the session that have been cash up then the Tender in which the Opening Float was done and the value will be displayed. This will be a Positive value since money has been added to the Terminal. |
| Closing Float | If any Closing float functions have been done within the session that have been cash up then the Tender in which the Closing Float was done and the value will be displayed. |
| Expected | The expected total value (systematic value) of the tender has been done on sales return and other cash flow functions. |
| Declared | The total amount that has been recorded by the user. |
| Discrepancy | The inconsistency between the Expected value and the Declared value (Declared value - Expected value). This can be either a positive or a negative value according to the values given while doing the Cash up or Finalise. |
| Grand Total against Functions | The total value against each Functions will be displayed. |
| Total | The total value against each Tender type will be displayed. |
In addition to the report summary, other functions such as view and export are available. The options provide the reports to be Printed or to view the report in PDF and to export the report in XLS or DOC format.
The Back button returns the user to the previous screen.
This completes the CashUp Summary Report.
Income Expense Transactions
The Income Expense Transactions report can be generated for either a Safe or a Terminal. This report details the income and expenses recorded in cash management sessions.
Navigation
Navigate to the Income Expense Report using the Search or the path: Reports > Cash Management Reports > Income Expense Report

Prerequisite: To generate this report, Cash Management sessions need to include functions for both Income and Expenses. These functions can be done on either a Terminal or a Safe.
Filter
There are the following filters that help to filter the reporting data.

| Filter Criteria | Description |
|---|---|
| Location | Dropdown list selection of defined Locations. |
| User | Dropdown list selection of defined Users at the Location specified in the previous field. If no Location is specified all Users configured are shown. |
| Safe / Terminal | Dropdown selection from a list of all Safes and Terminals at the Location specified in a previous field. If no Location is specified all Safes and Terminals configured are shown. |
| Reason | Dropdown list selection of defined Income and Expense Reasons. |
| Date Range | The start and end period in which the reports needs to be generated. |
The Reset button resets all the filters to their default value. The Back button returns the user to the previous screen. The Next button creates a Scheduled Job to run the report.
Summary
Once the report has been generated the following screen is displayed.

| Report Column Criteria | Description |
|---|---|
| Location | The Defined location on the Filter Criteria. If the location was not selected in the Filter, then all the locations associated with the EM will be displayed. |
| Terminal / Safe | The Defined Terminal / Safe on the filter criteria. |
| Operation | This value will be either Terminal Expense or Terminal Income according to the action taken placed in the cash management session for the selected Terminal or Safe. |
| User | The Store user who has done the Income or the Expenses in the terminal or safe. |
| Auth User | The name of the User who authorised the action if applicable. |
| Reasons | The reason for the Income or the Expense transactions. |
| Date/Time | The date and time at which the action was performed. |
| Tender | The type of tender used for the Income or the Expenses transactions. |
| Value | The Total value of the tender used for the Income or the Expenses transactions. |
| Grand Total for Terminal | The Accumulated total value of the income/expense transaction for the terminal/safe. The Income will be a positive value whereas the expense will be a negative value. |
| Grand Total for Location | The Accumulated total value of the income/expense transaction for the location. The Income will be a positive value whereas the expense will be a negative value. |
In addition to the report summary, other functions such as view and export are available. The options provide the reports to be Printed or to view the report in PDF and to export the report in XLS or DOC format.
The Back button returns the user to the previous screen.
This completes the Income Expense Transactions Report.
Outlay Transactions Report
The Outlay Transactions report summarises the outlay transactions that have been selected from either the Safe or a terminal. Outlay transactions involve withdrawing money from the Safe or terminal before expenses are encountered. Subsequently, expenses must be recorded, and this process allows for the return of change to the original outlay. For more detailed information about outlays, refer to the How-to Guide on Outlays.
The report is divided into three sections:
- Unbalanced Outlays - Records related to outlay expenses that are unbalanced in the cash management session. This includes cases where the expenses did not return any change or where there are discrepancies between the expenses and the change returned in the transactions.
- Balanced Outlays - If there are records related to balanced outlay expenses in the cash management session, a record will be added to this section. This section will include a record where the expenses and the changes that have been submitted are tallied and matched.
- Expenses without Outlay - If there are expenses that have not been recorded as outlay expenses, they will be listed in this section.
Navigation
Navigate to the Outlay Transactions Report using the Search or the path: Reports > Cash Management Reports > Outlay Transactions Report

Prerequisite: To generate this report, the cash management session must include balanced and unbalanced outlays, as well as expenses that do not have any corresponding outlay records.
Filter
There are the following filters that help to filter the reporting data.

| Filter Criteria | Description |
|---|---|
| Location | Dropdown list selection of defined Locations. |
| Date Range | The start and end period in which the reports need to be generated. |
| Hide Unbalanced | Controls the Unbalanced section in the report. When set to No, the Unbalanced section will be displayed. |
| Hide Balanced | Controls the Balanced section in the report. When set to No, the Balanced section will be displayed. |
| Hide Expenses without Outlay | Controls the Expenses without Outlay section in the report. When set to No, the Expenses without Outlay section will be displayed. |
The Reset button resets all the filters to their default value. The Back button returns the user to the previous screen. The Next button creates a Scheduled Job to run the report.
Summary
Once the report has been generated the following screen is displayed.
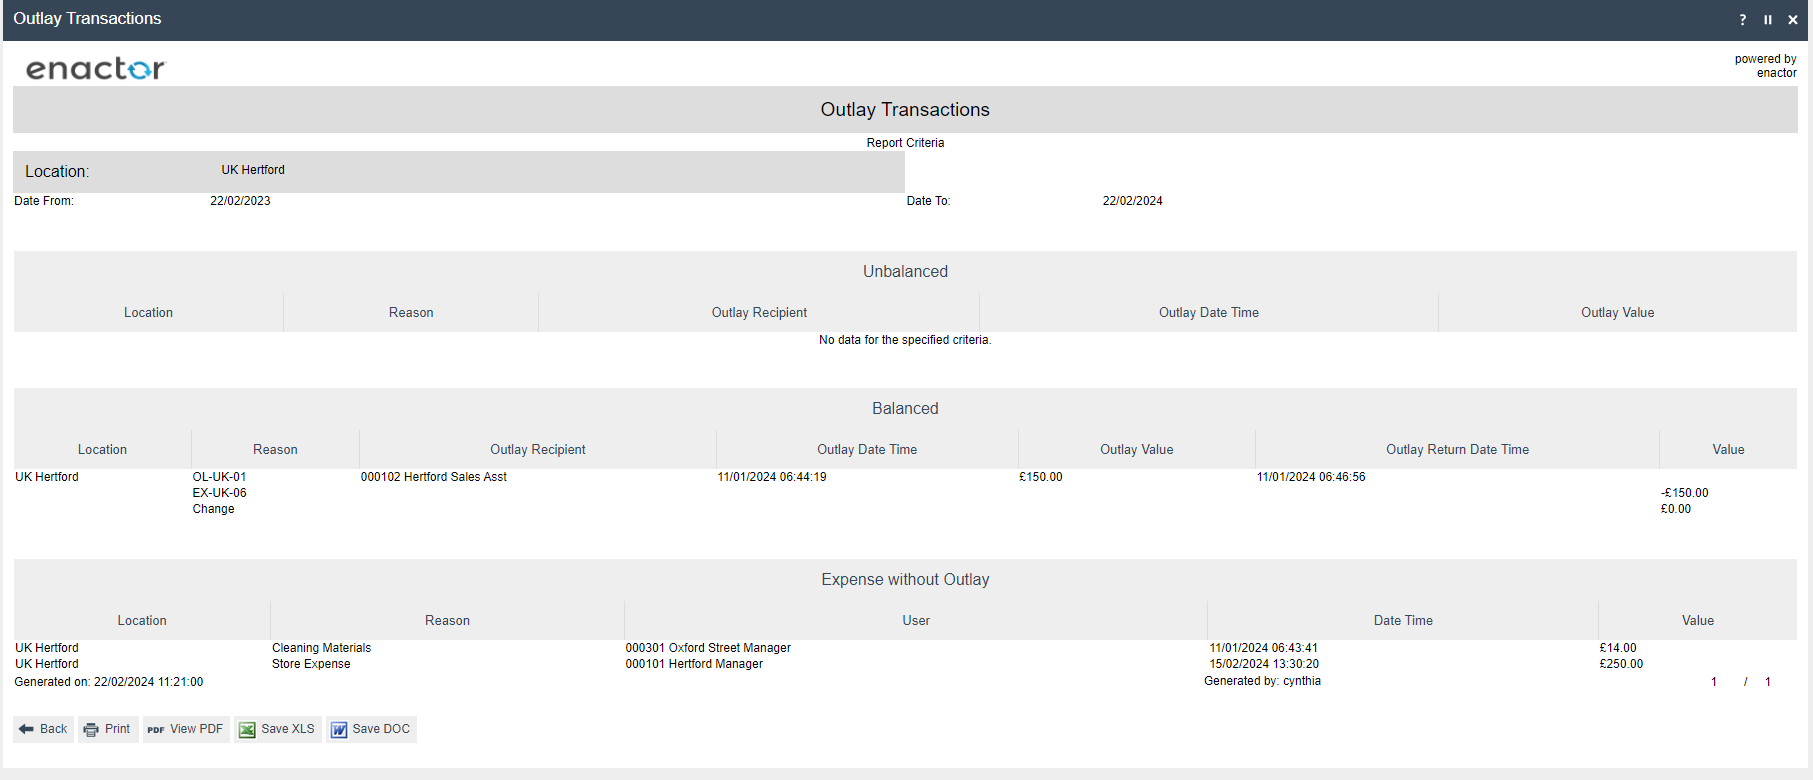
Unbalanced Section (displayed when the Filter screen Hide Unbalanced field is selected as No):
| Report Column Criteria | Description |
|---|---|
| Location | The Defined location on the Filter Criteria. If the location was not selected in the Filter, then all the locations associated with the EM will be displayed. |
| Reason | The Outlay Reason which was selected when the Outlay request was created. |
| Outlay Recipient | The user who has performed the Outlay request will be displayed. |
| Outlay Date Time | The Date and the time at which the outlay has been completed. |
| Outlay Value | The Value of the Outlay Expense is done. |
Balanced Section (displayed when the Filter screen Hide balanced field is selected as No):
| Report Column Criteria | Description |
|---|---|
| Location | The Defined location on the Filter Criteria. If the location was not selected in the Filter, then all the locations associated with the EM will be displayed. |
| Reason | The Outlay Reason which was selected when the Outlay request was created. |
| Outlay Recipient | The user who has performed the Outlay request will be displayed. |
| Outlay Date Time | The Date and the time at which the outlay has been completed. |
| Outlay Value | The Value of the Outlay Expense done. |
| Outlay Return Date Time | The Date and time when the change was submitted. |
| Value | The Value of the change for the Outlay Expense is done. |
Expense without Outlay Section (displayed when the Filter screen Hide Expense without Outlay field is selected as No):
| Report Column Criteria | Description |
|---|---|
| Location | The Defined location on the Filter Criteria. If the location was not selected in the Filter, then all the locations associated with the EM will be displayed. |
| Reason | The Reason which was selected when the expense was created. |
| User | The user details who have done the Expense transaction. |
| Date Time | The Date and the time at which the Expense was done. |
| Value | The Value of the Expense is done. |
In addition to the report summary, other functions such as view and export are available. The options provide the reports to be Printed or to view the report in PDF and to export the report in XLS or DOC format.
The Back button returns the user to the previous screen.
This completes the Outlay Transactions Report.
Overview Report
The Overview Report is a standard report for the Safe and Terminal. It provides a summary of the Safe or Terminal status based on the selected date in the criteria. It shows the amount in the Cash Drawer and whether there have been any cashup functions happening on the selected dates.
Navigation
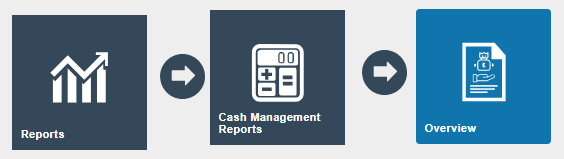
Navigate to the Overview Report using the Search or the path: Reports > Cash Management Reports > Overview Report
Prerequisite: To generate the Overview Report, Cash Management sessions must include specific functions that can be performed on either a Terminal or a Safe.
Filter
There are the following filters that help to filter the reporting data.

| Filter Criteria | Description |
|---|---|
| Location | Dropdown list selection of defined Locations. |
| Owner Type | The Owner type can be either Safe, Terminal, or Paypoint. This value is the method of cash management declaration in location maintenance. If no values are selected, the report will include values for all owner types at the respective locations. |
| Start Date Time | The From Date which the report needs to be Generated From. |
| End Date Time | The To Date which the report needs to be Generated To. |
The Reset button resets all the filters to their default value. The Back button returns the user to the previous screen. The Next button creates a Scheduled Job to run the report.
Summary
Once the report has been generated the following screen is displayed.

The report is divided into two sections, one for Terminal-related data and the other for Safe-related data.
Terminal Section:
| Report Column Criteria | Description |
|---|---|
| Terminal | The Terminal associated with the selected locations will be listed. |
| Tender | The tender type which has been used in the cash management transactions has been listed. |
| Stay in Drawer | The total amount of the tender which is there currently on the drawer will be displayed. |
| CashUp | The Total amount which has been Cashup and sent the Safe will be displayed. |
| Discrepancy | If there is a difference between the expected amount to be cashed up and the actual amount cashed up, the Discrepancy amount will be updated to reflect this difference. |
Safe Section:
| Report Column Criteria | Description |
|---|---|
| Safe | The Safe associated to the selected locations will be listed. |
| Tender | The tender type which has been used in the cash management transactions are being listed. |
| Stay in Drawer | The total amount of the tender which is there currently in the drawer will be displayed. |
| CashUp | The Total amount which has been Cashup and sent to bank will be displayed. |
| Discrepancy | If there is a difference between the expected amount to be cashed up and the actual amount cashed up, the Discrepancy amount will be updated to reflect this difference. |
In addition to the report summary, other functions such as view and export are available. The options provide the reports to be Printed or to view the report in PDF and to export the report in XLS or DOC format.
The Back button returns the user to the previous screen.
This completes the Overview Report.
Tender Bag Collection
The Tender Bag Collection report provides a summary of the bags that have been selected and sent to the bank. The data will be populated when the user uses the Bag functions to complete a Safe Banking function along with completing the Safe Bag Collection functionality. Compared to the other reports this is a printed report produced when the collection function was done.
Navigation
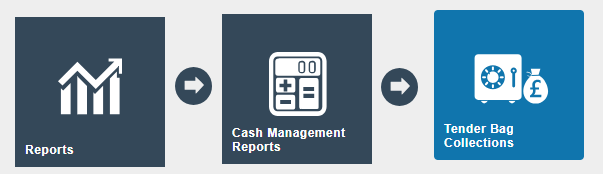
Navigate to the Tender Bag Collection using the Search or the path: Reports > Cash Management Reports > Tender Bag Collection
Prerequisite: The location must be set up to handle Tender Bags. This setup will be done in Location Maintenance. To include a record in the report for Safe, the user must create banking bags and bank them using the Safe Banking function, then the Bag which has been Banked needs to go through the Safe Bag Collection Process as well.
Filter
There are the following filters that help to filter the reporting data.

| Filter Criteria | Description |
|---|---|
| Location | Dropdown list selection of defined Locations. |
| Safe | Dropdown selection from a list of all Safes at the Location specified in a previous field. If no Location is specified all Safes configured are shown. |
| Date Range | The start and end period in which the reports need to be generated when the Cashup or finalised sessions are being performed. |
The Reset button resets all the filters to their default value. The Back button returns the user to the previous screen. The Next button creates a Scheduled Job to run the report.
Summary
Once the report has been generated the following screen is displayed.

| Report Column Criteria | Description |
|---|---|
| Tender Bag Number | The Bag number was given when creating the Banking bag. This is the reference number that differentiates the Bags with each other. |
| Date Time Collected | The Date and Time the Banking Bag has been collected and sent to the Bank. |
| Value | The Amount which was held in the Banking Bag. |
| Additional Bag | These are fields that the user can add additional information of the bags that has been sent to the bank. This field is something that is not prepopulated with data where it is a manual field. |
| Signature | The signature field that will be used by the user to add the signature of the user who has collected the bag for banking from the store. |
| Second Signature | The Second signature field will be used by an authorised user to add the signature of the user who has confirmed that the bag has been sent for banking from the store. |
In addition to the report summary, other functions such as view and export are available. The options provide the reports to be Printed or to view the report in PDF and to export the report in XLS or DOC format.
The Back button returns the user to the previous screen.
This completes the Tender Bag Collection Report.
Terminal Discrepancies
The Terminal Discrepancies report indicates the discrepancy values that have been recorded in each cashup session or on the finalised session on the selective terminals. This report is generated for the Terminal specifically since the session owner in this report will be listed according to the Location's Cash Management method whether it is a Pay point, Terminal, or a cashier.
Navigation
Navigate to the Terminal Discrepancies Report using the Search or the path: Reports > Cash Management Reports > Terminal Discrepancies Report

Prerequisite: The records will be populated for the report when an open session has been marked as Cash up or a Cash up session to Finalise in the terminal with discrepancy values.
Filter
There are the following filters that help to filter the reporting data.
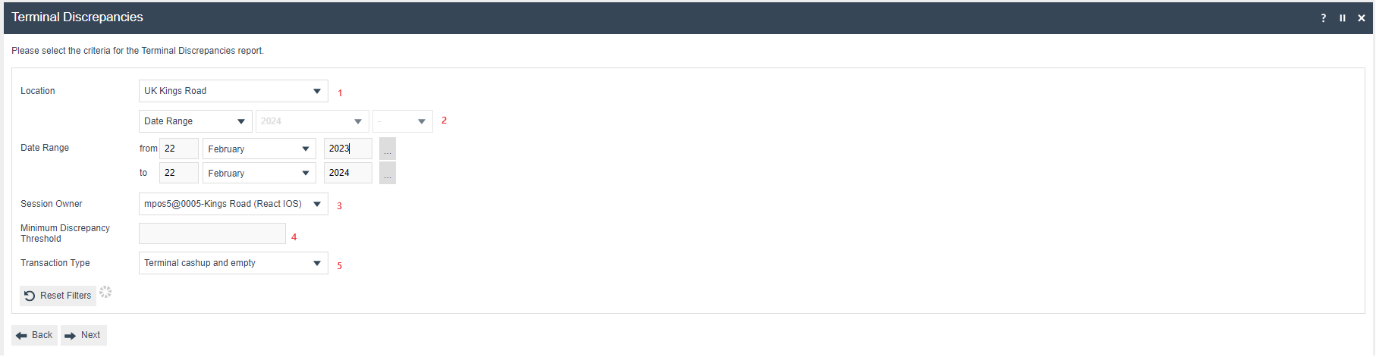
| Filter Criteria | Description |
|---|---|
| Location | Dropdown list selection of defined Locations. |
| Date Range | The start and end period in which the reports need to be generated when the Cashup or finalised sessions are being performed. |
| Session Owner | This report is generated for the Terminal specifically since the session owner in this report will be listed according to the Location's cash Management method whether it is a Pay point, Terminal, or a cashier. |
| Minimum Discrepancy Threshold | If there is a specific need to give a minimum value of discrepancy, then the user would be able to add the value in the filter criteria so that the report will be generated to the value above the Threshold. |
| Transaction Type | This is the cash management transaction type that must be selected. The only cash management transaction type associated with discrepancy is when a terminal has been cashed up or the sessions have been finalised. The values in the criteria would be either Terminal Cashup and Empty or Terminal Finalised. |
The Reset button resets all the filters to their default value. The Back button returns the user to the previous screen. The Next button creates a Scheduled Job to run the report.
Summary
Once the report has been generated the following screen is displayed.

| Report Column Criteria | Description |
|---|---|
| Location | The Defined location on the Filter Criteria. If the location was not selected in the Filter, then all the locations associated with the EM will be displayed. |
| Terminal | The session owner selected in the Filter screen will be displayed. Usually, the session owner is the same as the terminal ID. If a location is selected in the Filter screen but the session owner field is not specified, then all terminals associated with that location that have discrepancies during cashup or finalise will be listed. |
| Date Time | The date and time at which the cashup or finalise was performed and had discrepancies. |
| Tender | The type of tender that has the discrepancies while the cashup or finalise was performed. |
| Expected | The expected total value (systematic value) of the tender has been done on sales return and other cash flow functions. |
| Declared | The total amount that has been recorded by the user. |
| Discrepancy | The inconsistency between the Expected value and the Declared value (Declared value - Expected value). This can be either a positive or a negative value according to the values given while doing the Cash up or Finalise. |
In addition to the report summary, other functions such as view and export are available. The options provide the reports to be Printed or to view the report in PDF and to export the report in XLS or DOC format.
The Back button returns the user to the previous screen.
This completes the Terminal Discrepancies Report.
Safe Discrepancies
The Safe Discrepancies report is similar to the Terminal Discrepancies report. It indicates the discrepancy values that have been recorded in each cashup session or on the finalised session on the selective Safes. This report is generated for the Safes specifically that are configured according to the location.
Navigation
Navigate to the Safe Discrepancies Report using the Search or the path: Reports > Cash Management Reports > Safe Discrepancies Report

Prerequisite: The records will be populated for the report when an open session has been marked as Cash up or a Cash up session to Finalise in the Safe with discrepancy values.
Filter
There are the following filters that help to filter the reporting data.

| Filter Criteria | Description |
|---|---|
| Location | Dropdown list selection of defined Locations. |
| Date Range | The start and end period in which the reports need to be generated when the Cashup or finalised sessions are being performed. |
| Safe | Dropdown selection from a list of all Safes at the Location specified in a previous field. If no Location is specified all Safes configured are shown. |
The Reset button resets all the filters to their default value. The Back button returns the user to the previous screen. The Next button creates a Scheduled Job to run the report.
Summary
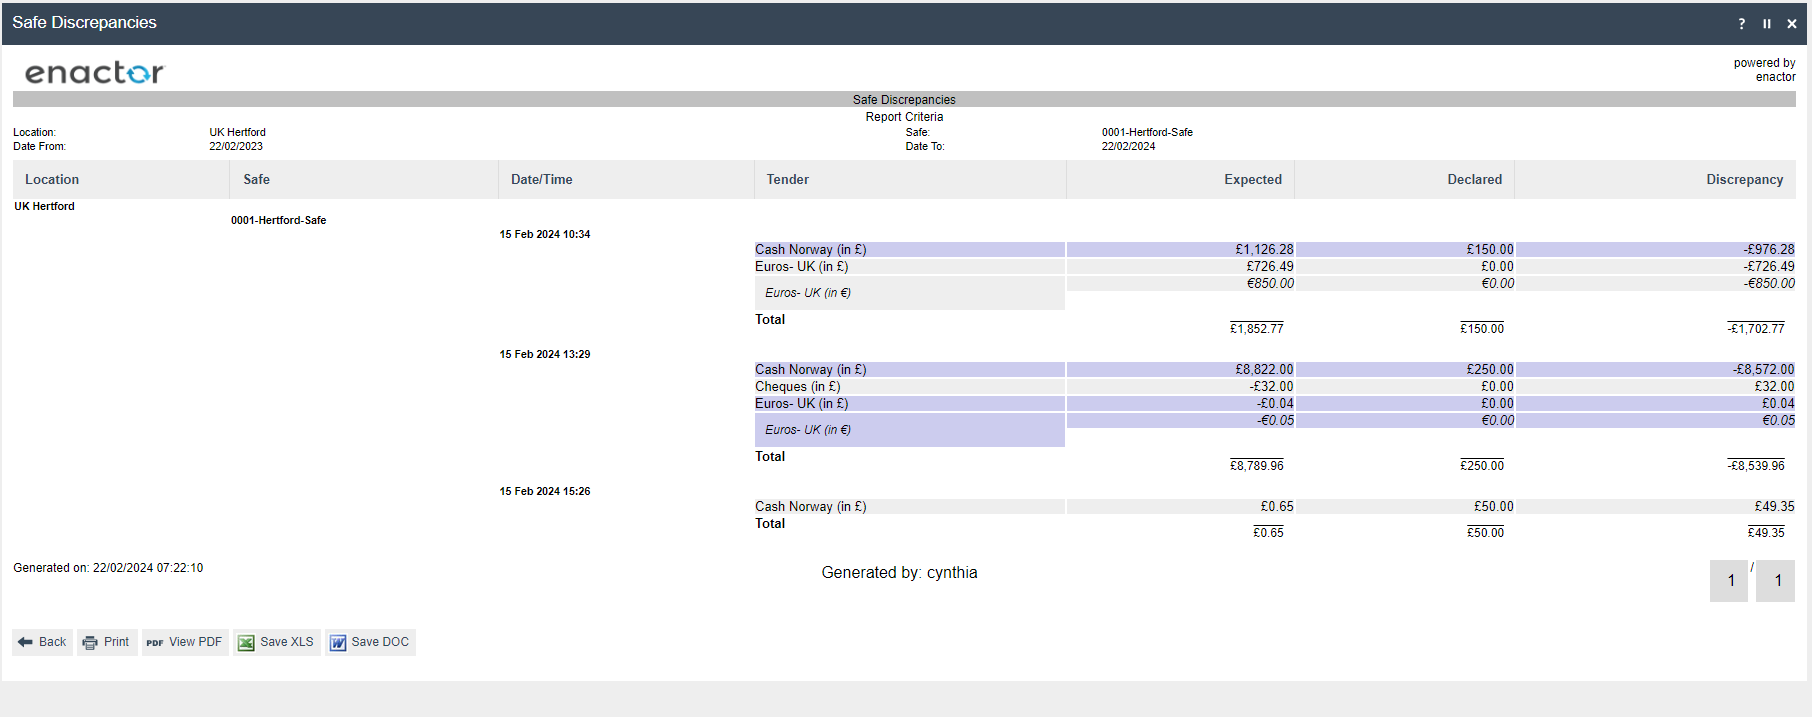
Once the report has been generated the following screen is displayed.
| Report Column Criteria | Description |
|---|---|
| Location | The Defined location on the Filter Criteria. If the location was not selected in the Filter, then all the locations associated with the EM will be displayed. |
| Safe | The Safe selected in the Filter screen will be displayed. If a location is selected in the Filter screen but the Safe field is not specified, then all Safes associated with that location that have discrepancies during cashup or finalise will be listed. |
| Date Time | The date and time at which the cashup or finalise was performed and had discrepancies for the Safe. |
| Tender | The type of tender that has the discrepancies while the cashup or finalise was performed. |
| Expected | The expected total value (systematic value) of the tender has been done on sales return and other cash flow functions. |
| Declared | The total amount that has been recorded by the user. |
| Discrepancy | The inconsistency between the Expected value and the Declared value (Declared value - Expected value). This can be either a positive or a negative value according to the values given while doing the Cash up or Finalise. |
| Total | The total value against the safe will be listed. |
In addition to the report summary, other functions such as view and export are available. The options provide the reports to be Printed or to view the report in PDF and to export the report in XLS or DOC format.
The Back button returns the user to the previous screen.
This completes the Safe Discrepancies Report.