Configuring EM Log Frequency View
Overview
The Log Frequency View helps users quickly identify the most common issues in application logs by grouping identical log entries and displaying them ordered by frequency, from highest to lowest.
Instead of scanning logs chronologically, this view highlights which errors or warnings occur most often, making it easier to prioritize investigation and resolution.
- Availability: Estate Manager
- Default State: This feature is off by default and must be enabled by the operator.
Key Benefits: Why Use This Feature?
- Prioritization: Quickly identify recurring issues and systemic problems that warrant immediate attention.
- Efficiency: Reduce the time spent reviewing large log files by focusing on the most frequent events.
- Clarity: Instantly see how many times each unique log entry has occurred via a dedicated Frequency column.
- Focus: Default analysis targets the top 10 most common log events.
Using Log Frequency View
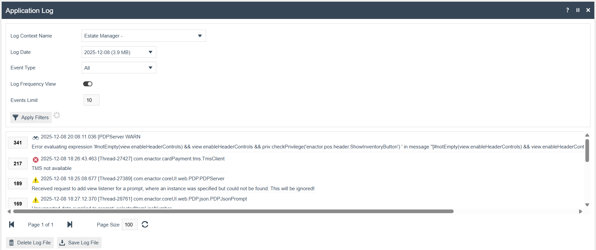
- Navigate: Go to the Application Log Maintenance page (Estate Manager → Administration → Logs → Application Log).
- Select Criteria:
- Choose the required Log File by selecting Log Context Name and Log Date
- Select Event Type (e.g., All, Errors, Warnings, Infomation, Trace, Debug).
- Enable Frequency View: Toggle on the Log Frequency View option.
- Set Result Limit (Optional): A dedicated field will appear. The current default is 10 (showing the top 10 most frequent logs).
- Run Analysis: Click Apply Filters to execute the frequency analysis and refresh the result
- View Results: The logs are presented in a new format, featuring:
- Grouping: Identical log messages are condensed into a single entry.
- Sorting: Results are sorted exclusively by Frequency (Highest → Lowest).
- Metrics: A Frequency column shows the total number of occurrences for that specific log entry.
- Reset Behavior
- When the user exit the Application Log Maintenance screen: all filters and frequency view settings are reset to default values.
- When Frequency View is disabled, the event limit field resets to its default value (10)
- Default settings apply when you re-enter the maintenance page.
Limitations
- Download Restriction: Logs cannot be downloaded in frequency order in the current release.
- Performance Guardrail: If a log file is too large to process efficiently, a message will be displayed, and the frequency analysis will be blocked to avoid system impact.
Configuration
- No additional configuration is required.
- The feature is enabled directly via the filter screen toggle in the Application Log Maintenance.