Enactor Tools - Version 1.3.389
Release Date - Nov 10,2023
Overview
This release mainly includes bug fixes related to Debugging Application Processes, React Component support for UI and Documentation on Debugging Application Processes, Extension Points and React Components.
Deliverables and Versions
| Enactor Tools | Version: 1.3.389 |
|---|---|
| Eclipse | 2023-9 |
| Java (Eclipse Launch)   | 17 |
| OS | Mac 13.0.1,   Ubuntu 18.04.6 LTS/22.04.3 LTS,   Windows 11 |
IMPORTANT
- Add the following parameter to eclipse.ini if it does not exist:
--add-opens=java.base/java.lang=ALL-UNNAMED
IMPORTANT
-
If you are using Ubuntu 22 or above and have issues with Enactor Tools not working properly Go to /etc/gdm3/custom.conf and uncomment below line.
-
WaylandEnable=false
Changes
| Ref | Summary |
|---|---|
| DT-314 | Remove Editors/Wizards that we no longer use |
| DT-350 | Resource Library - Update Console Log |
| DT-353 | AEnactor ToolKit Documentation - Enhancements |
| DT-364 | Add Details for React Component in the Resource Library Information View |
Bug Fixes
| Ref | Summary |
|---|---|
| DT-330 | BreakPoints don't persist when added to Application Processes from JARs |
| DT-343 | Errors in the process editor when restarting Eclipse with processes from JARS opened in |
| DT-344 | Enable/Disable breakpoints doesn't work for Application Processes from JARs |
| DT-356 | Link with Package Editor Not working for Application Processes |
| DT-357 | Copy / Paste of an Application Process results in an error |
| DT-362 | Fix Minor Bugs with React Component Support for Tools |
| DT-377 | Remove/Remove All breakpoints from breakpoint tab doesn't immediately update process editor ui for Application Processes from JARS |
Debugging Application Processes Inside Enactor JARs
In Order to debug Application Processes from JARs you need to first index the resources. If your workspace indexes aren't up-to date updates indexes using resource library.
Windows → Show View →Enactor Tools → Resource Library → Update Indexes

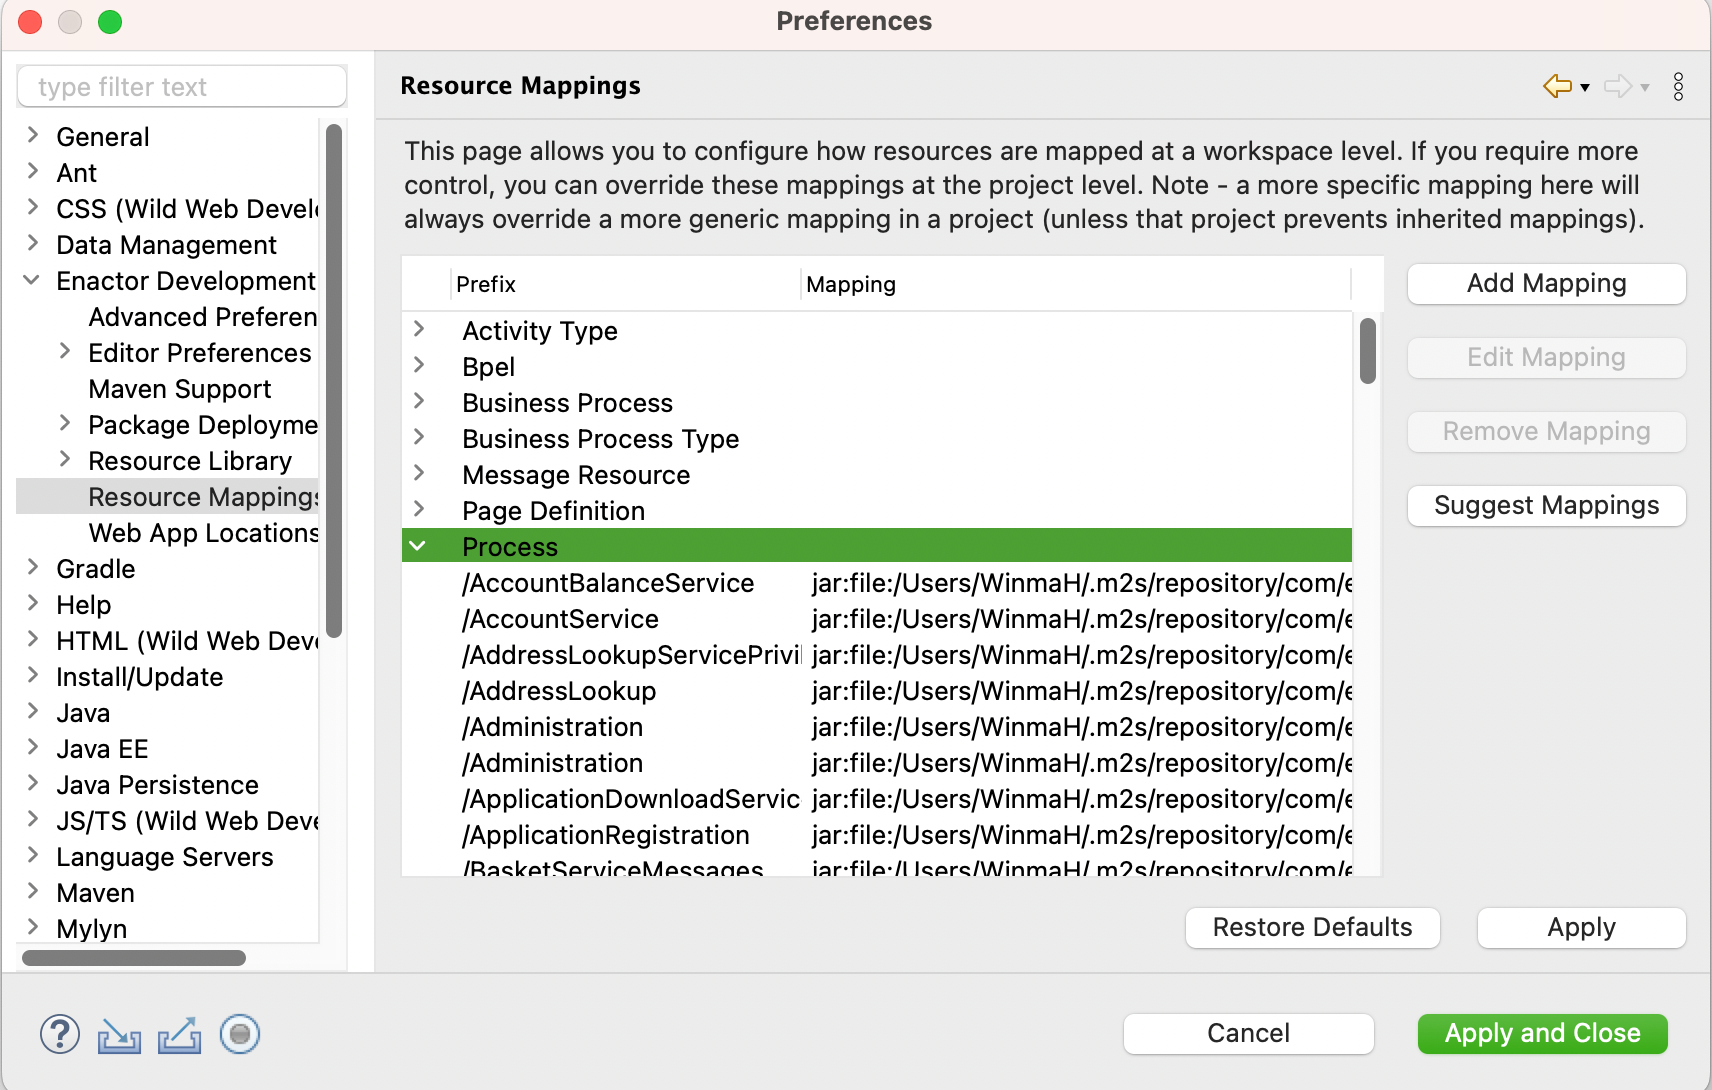
After Indexing is completed Add mappings for the jar processes
Go to Eclipse Preferences → Enactor Development → Resource Mapping and click on Process → Suggest Mappings.

Select All mappings suggested for processes and Finish .
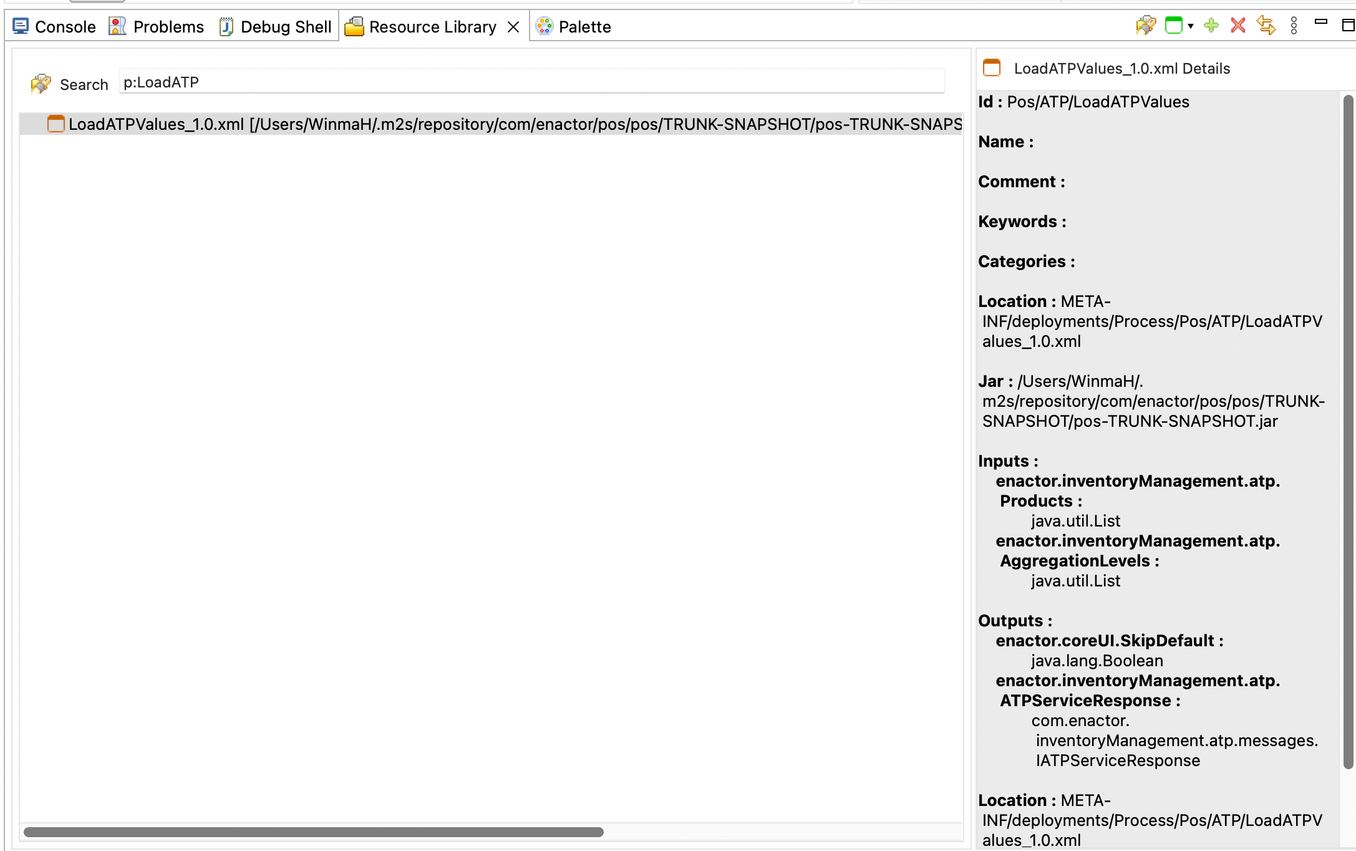
Now If you need to add a breakpoint to a application process from a Jar Go to Resource Library and Search for the Processes, double click and open it to add breakpoints.

You can also step into processes from jars while debugging.