Launch / Trace / Navigate
Overview
Investigating issues is possible using the Tracing and/or Debugging feature provided by the Enactor Tools
What You Will Learn
-
Tracing - Visually navigates through actions and application processes in real-time
-
Debugging - Allows you to pause the execution at specific breakpoints of the application process, observe the application state, and steps through its execution.
Process Tracing and Debugging
Create a Process Debug Launch Configuration
To debug an Application Process, first you will need to create a run Process Debug configuration.
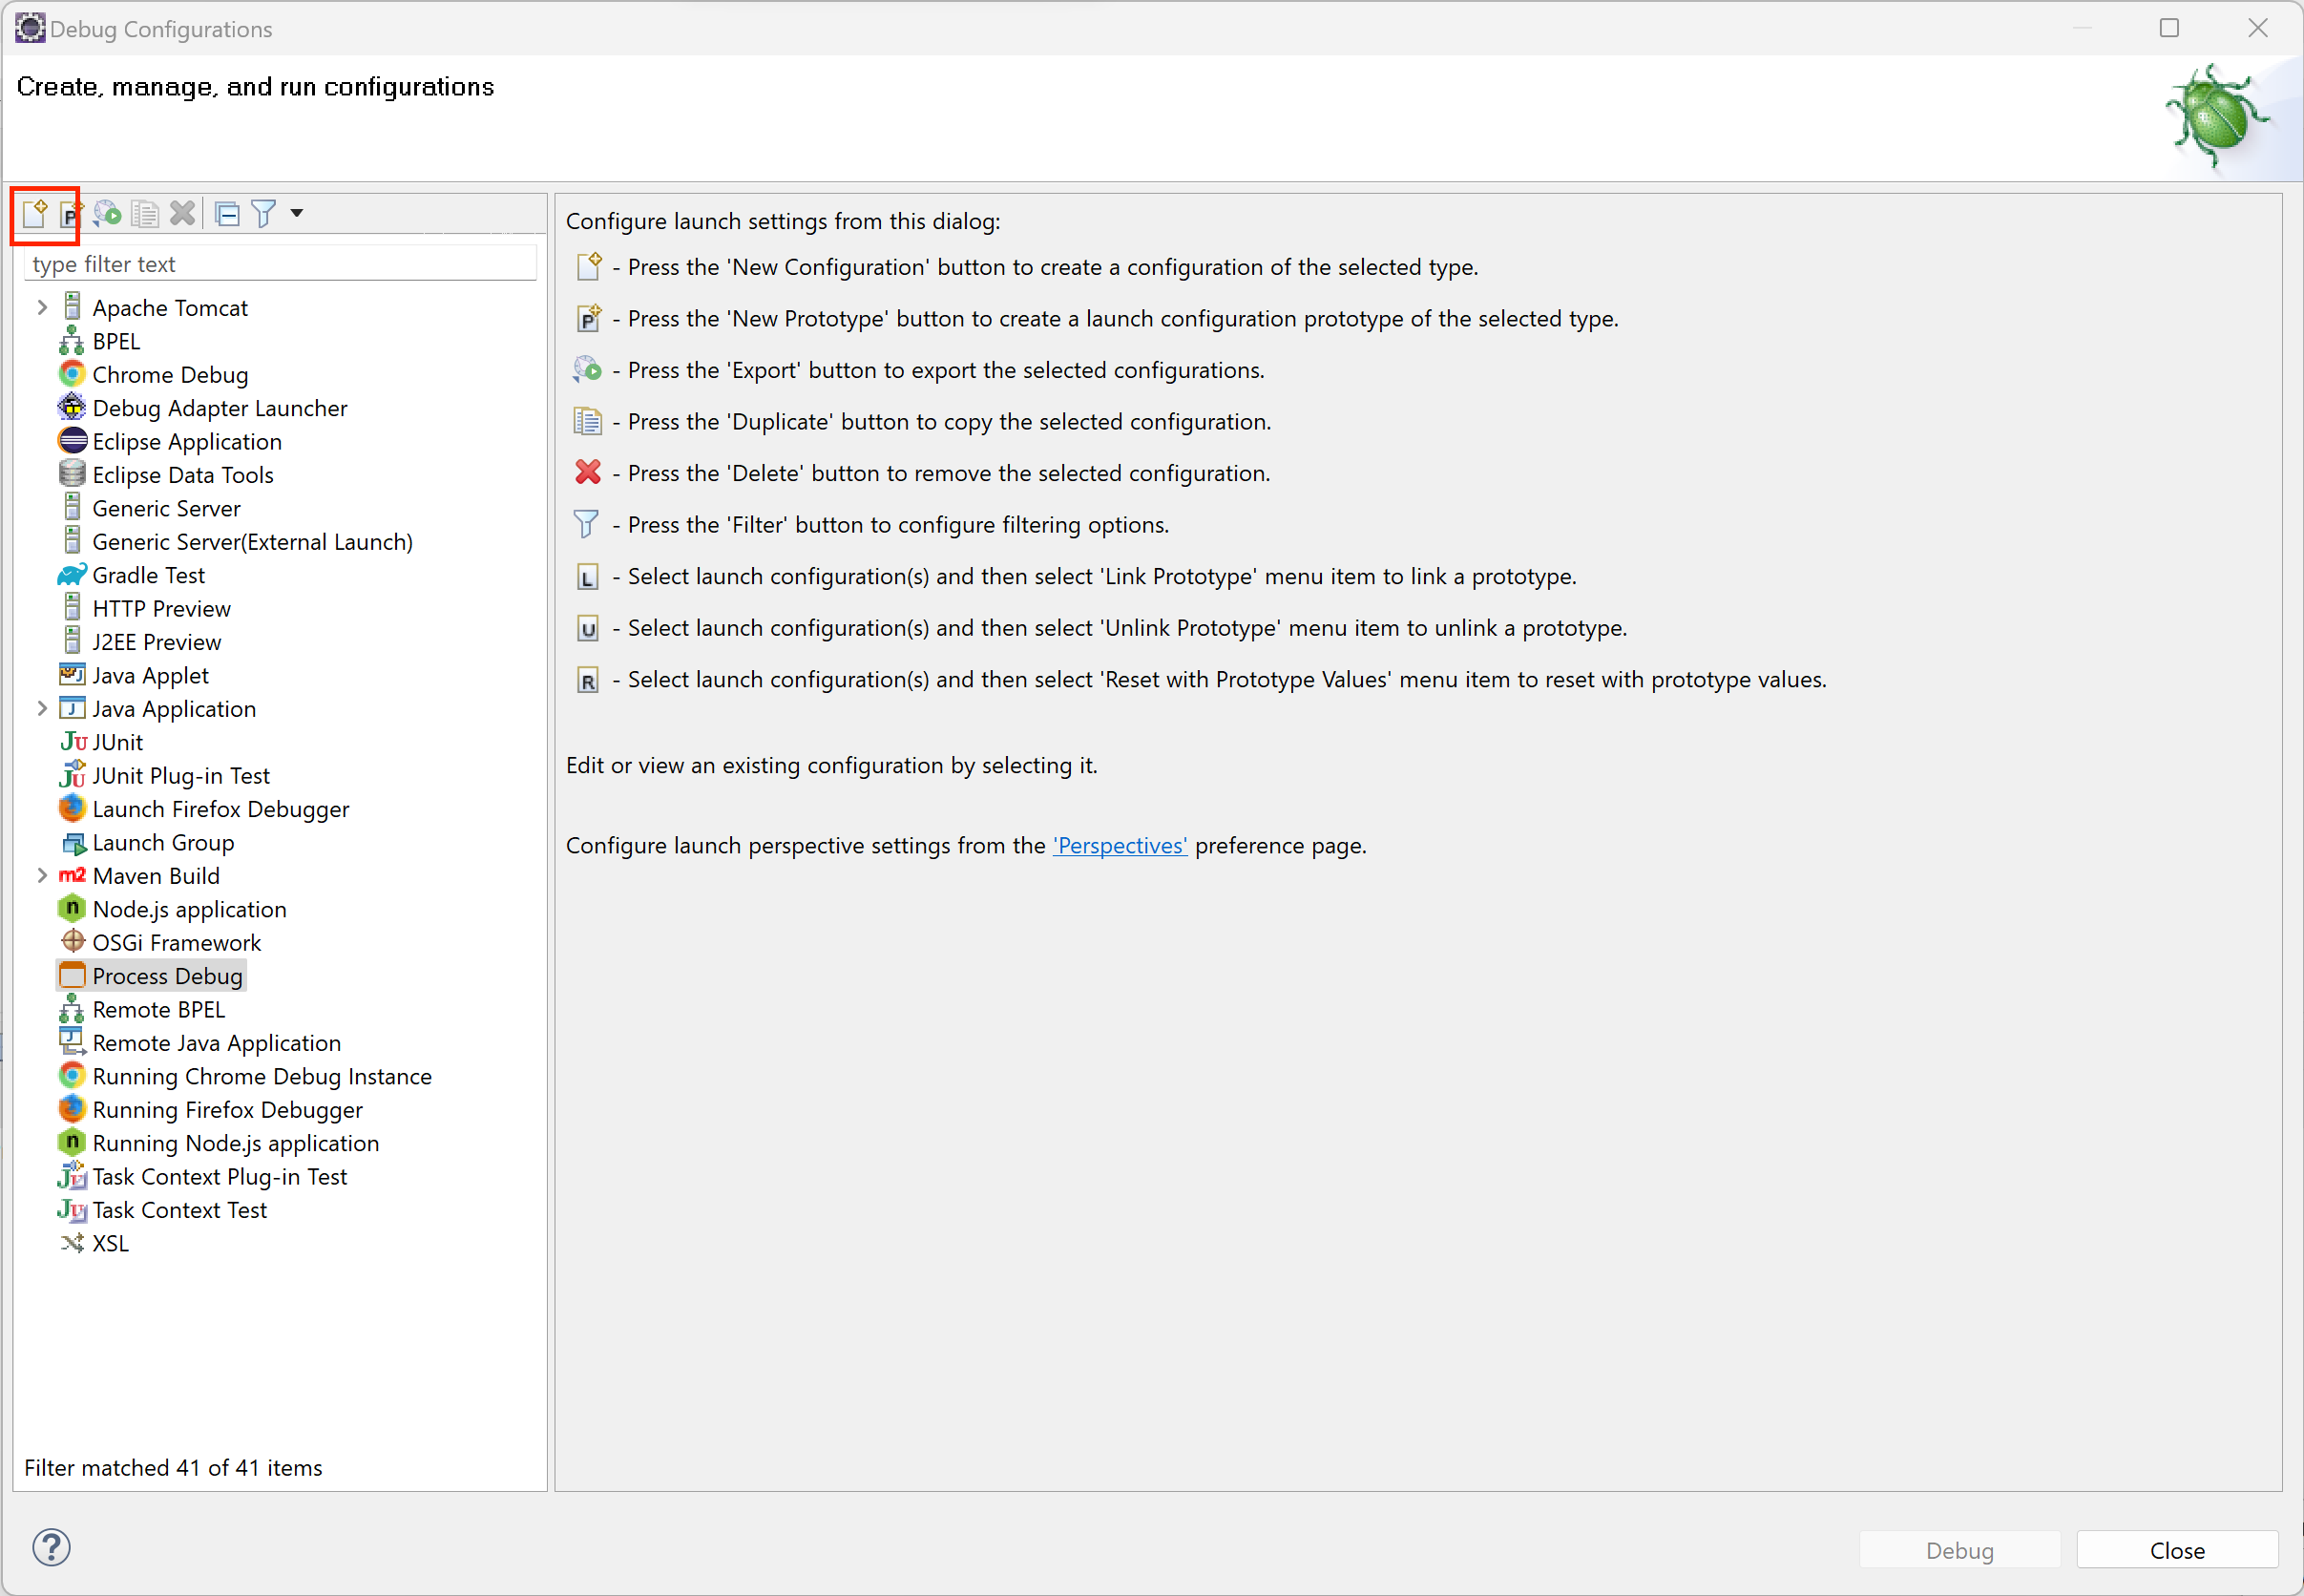
Select menu Run > Debug Configurations...
Select the Process Debug group
Create New Process Debug by seleting the New Launch Configuration icon
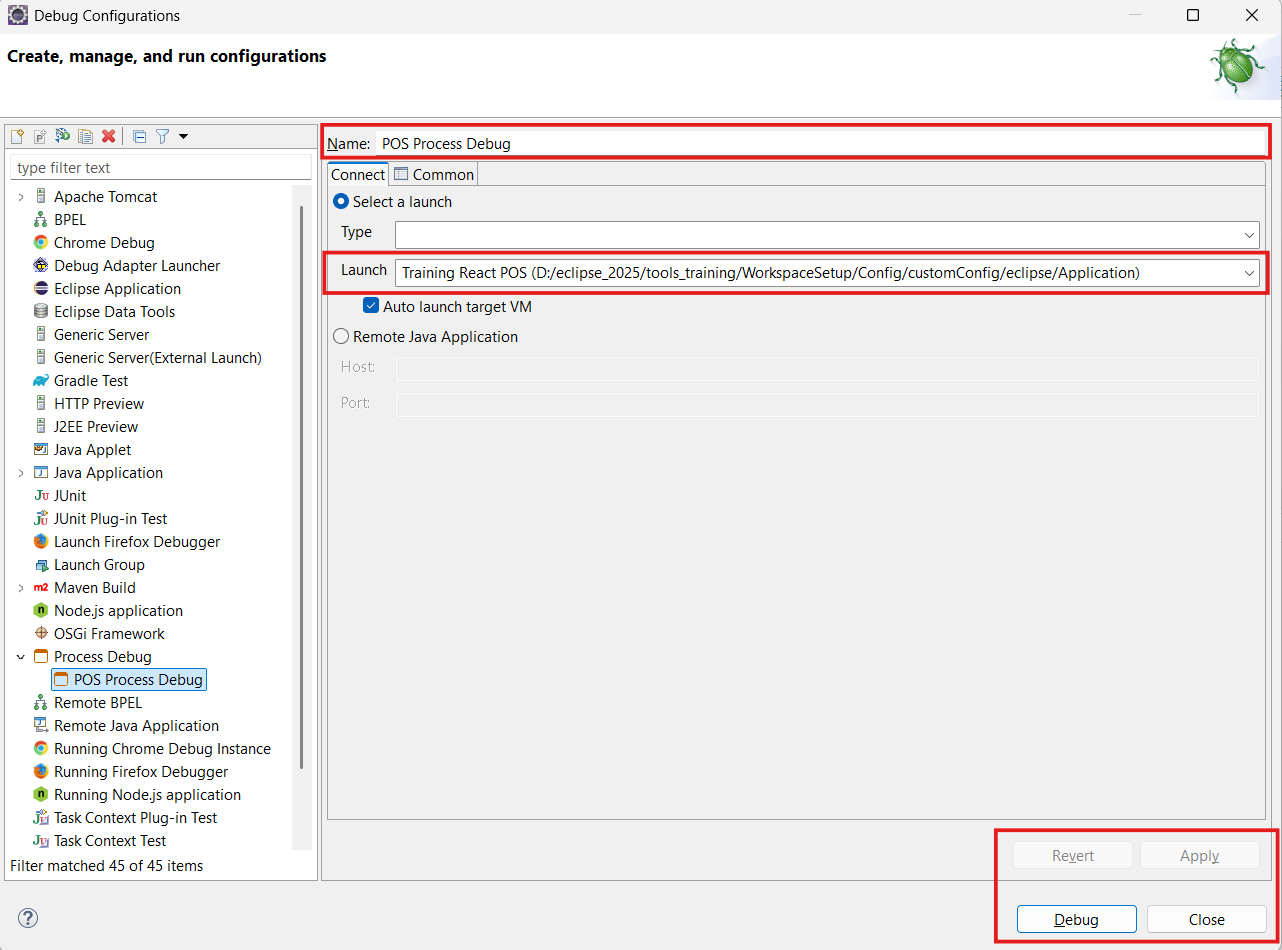
Update the Name text box by entering POS Process Debug
From the drop-down of launch select Training React POS
Click Apply...button
Click Debug...button
This type of launch will either launch the application if not already running otherwise attach it self to the running application, providing its already running in debug mode
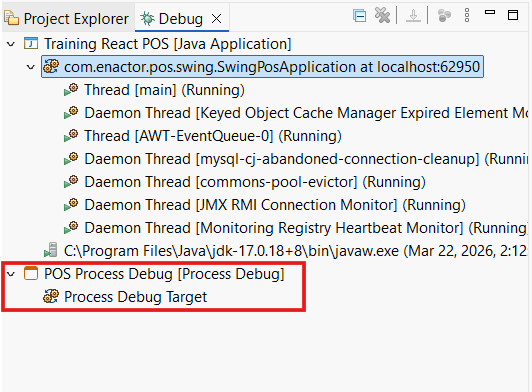
To validate your application is running with process debug
Select and open the Debug View
Select an Application Process to trace, Bring up the Resource Library and seach for WaitForSignOn
Select and Open the Application Process
From the Toolbar of the Application Process, Select the trace option

Return to the Running Application and sign in.
You can use the slider next to the trace button to control the speed of the trace

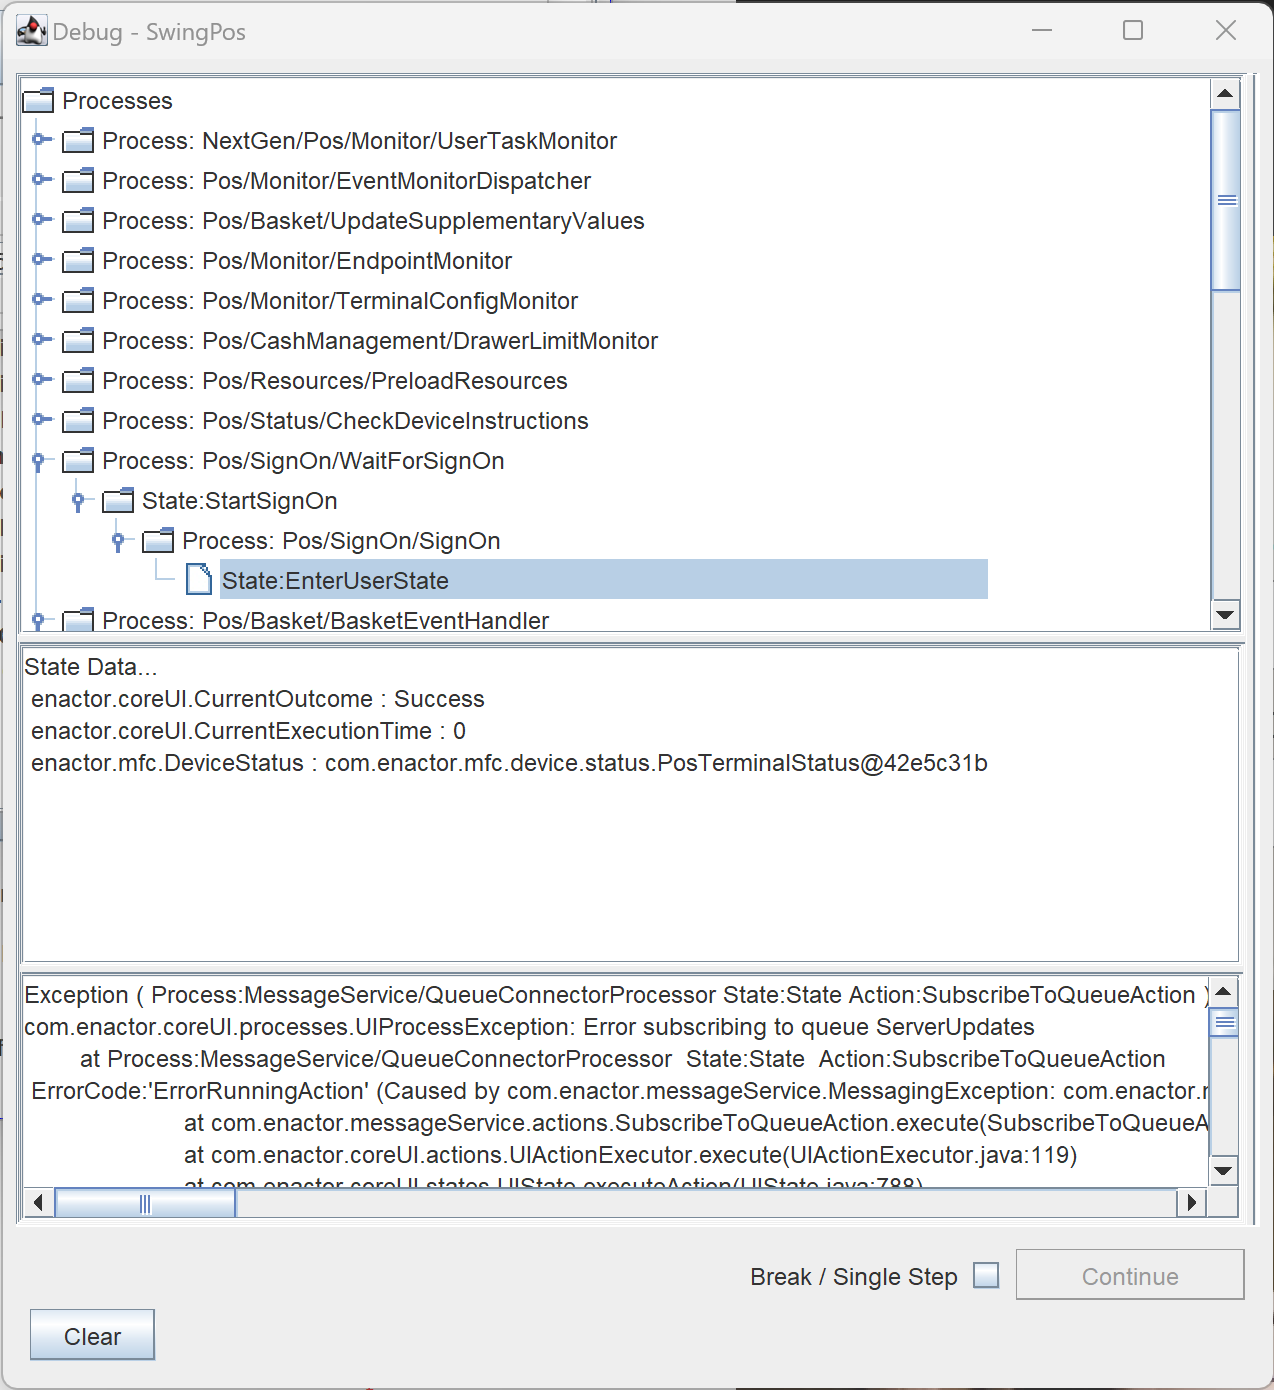
Built In Debug Frame
When running the POS, you can display an additional window frame that shows the current running process and its call stack. To enable this feature, add the following Program Argument to your POS Launch Configuration
-debug
When launched, the pos will display an additional Window